

Question: Consider the following linear model: r-rf = a +B(rm -rf) + E where r, is the risk-free rate, rm is the return of the market
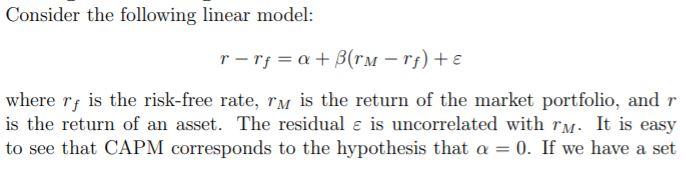
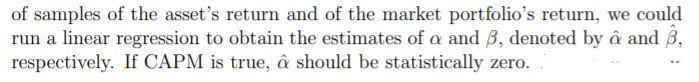
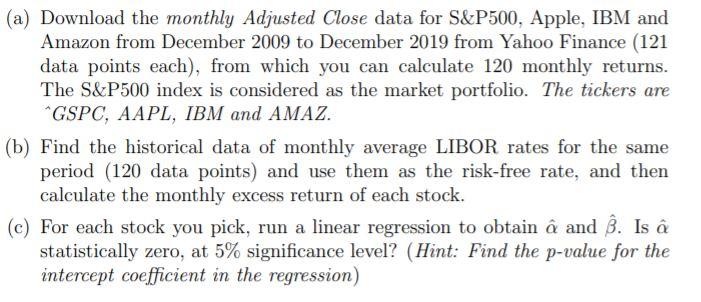
Consider the following linear model: r-rf = a +B(rm -rf) + E where r, is the risk-free rate, rm is the return of the market portfolio, and r is the return of an asset. The residual is uncorrelated with rm. It is easy to see that CAPM corresponds to the hypothesis that a = 0. If we have a set of samples of the asset's return and of the market portfolio's return, we could run a linear regression to obtain the estimates of a and B, denoted by and , respectively. If CAPM is true, should be statistically zero. (a) Download the monthly Adjusted Close data for S&P500, Apple, IBM and Amazon from December 2009 to December 2019 from Yahoo Finance (121 data points each), from which you can calculate 120 monthly returns. The S&P500 index is considered as the market portfolio. The tickers are "GSPC, AAPL, IBM and AMAZ. (b) Find the historical data of monthly average LIBOR rates for the same period (120 data points) and use them as the risk-free rate, and then calculate the monthly excess return of each stock. (c) For each stock you pick, run a linear regression to obtain and . Is a statistically zero, at 5% significance level? (Hint: Find the p-value for the intercept coefficient in the regression) Consider the following linear model: r-rf = a +B(rm -rf) + E where r, is the risk-free rate, rm is the return of the market portfolio, and r is the return of an asset. The residual is uncorrelated with rm. It is easy to see that CAPM corresponds to the hypothesis that a = 0. If we have a set of samples of the asset's return and of the market portfolio's return, we could run a linear regression to obtain the estimates of a and B, denoted by and , respectively. If CAPM is true, should be statistically zero. (a) Download the monthly Adjusted Close data for S&P500, Apple, IBM and Amazon from December 2009 to December 2019 from Yahoo Finance (121 data points each), from which you can calculate 120 monthly returns. The S&P500 index is considered as the market portfolio. The tickers are "GSPC, AAPL, IBM and AMAZ. (b) Find the historical data of monthly average LIBOR rates for the same period (120 data points) and use them as the risk-free rate, and then calculate the monthly excess return of each stock. (c) For each stock you pick, run a linear regression to obtain and . Is a statistically zero, at 5% significance level? (Hint: Find the p-value for the intercept coefficient in the regression)
Step by Step Solution
There are 3 Steps involved in it

Get step-by-step solutions from verified subject matter experts