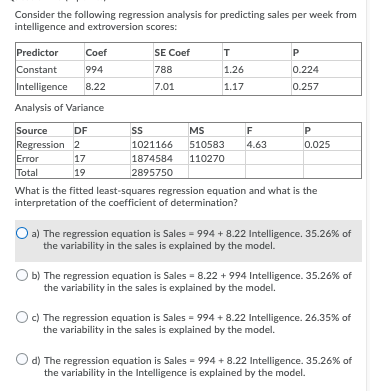
Consider the following regression analysis for predicting sales per week from intelligence and extroversion scores: Predictor Coef SE Coef T P Constant 994 788 1.26 0.224 Intelligence 8.22 7.01 1.17 0.257 Analysis of Variance Source DF SS MS F P Regression 2 1021166 510583 4.63 0.025 Error 17 1874584 110270 Total 19 2895750 What is the fitted least-squares regression equation and what is the interpretation of the coefficient of determination? () a) The regression equation is Sales = 994 + 8.22 Intelligence. 35.26% of the variability in the sales is explained by the model. () b) The regression equation is Sales = 8.22 + 994 Intelligence. 35.26% of the variability in the sales is explained by the model. (O c) The regression equation is Sales = 994 + 8.22 Intelligence. 26.35% of the variability in the sales is explained by the model. ( d) The regression equation is Sales = 994 + 8.22 Intelligence. 35.26% of the variability in the Intelligence is explained by the model.A drug for treating depression patients is evaluated for effectiveness. Three treatment options exist: 20 mg, 10 mg, and placebo (20, 10, P). Twelve patients are randomly assigned to provide 4 patients for each level. The change in score from a common test designed to quantify depression was recorded for each patient. The ANOVA summary from the test appears below: Source DF SS MS F Factor 228.17 Error 9 Total 257.67 Does it appear that the drug might be effective in changing depression level? State the null hypothesis, test statistic, critical value, and conclusion. (Use a = 0.05). ( a) TS = 34.78; CV = 4.26; reject Ho because the TS is > the CV; the drug (or perhaps the placebo) appears to have an effect on depression level. ( b) TS = 34.78; CV = 4.26; reject Ho because the TS is > the CV; the drug (or perhaps the placebo) does not appear to have an effect on depression level. O c) TS = 34.78; CV = 8.02; reject Ho because the TS is