

Consider the following statement: A fiscal expansion will always reduce investment in an economy. Now consider...
Fantastic news! We've Found the answer you've been seeking!
Question:
Transcribed Image Text:
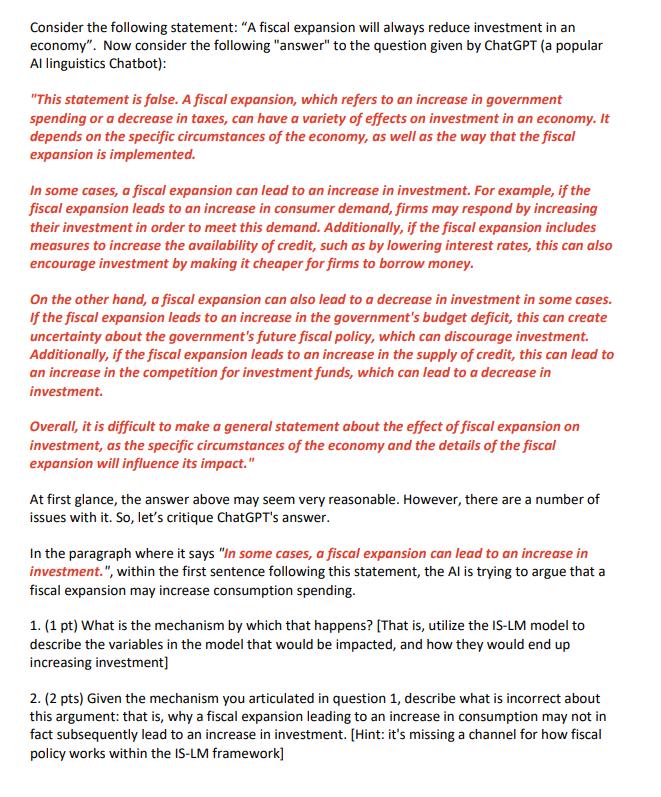
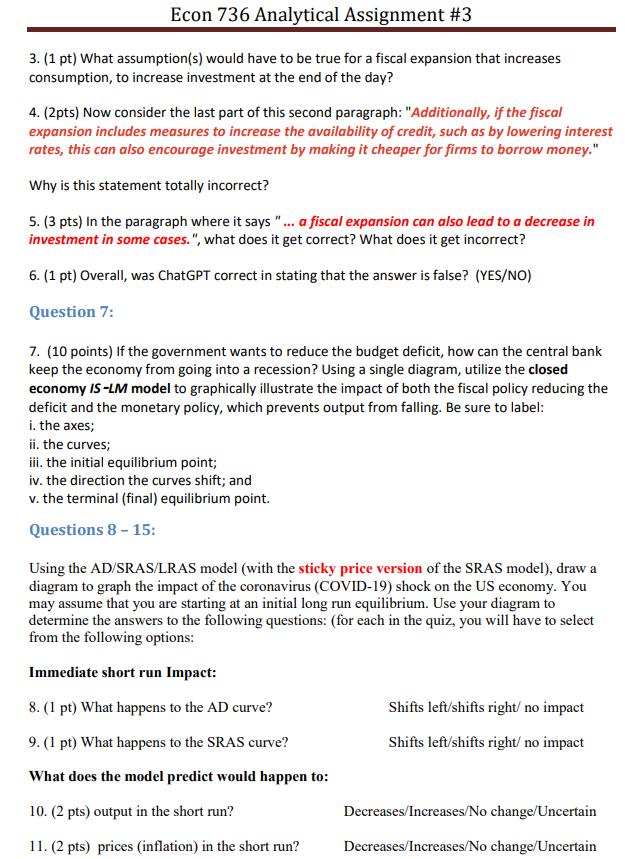
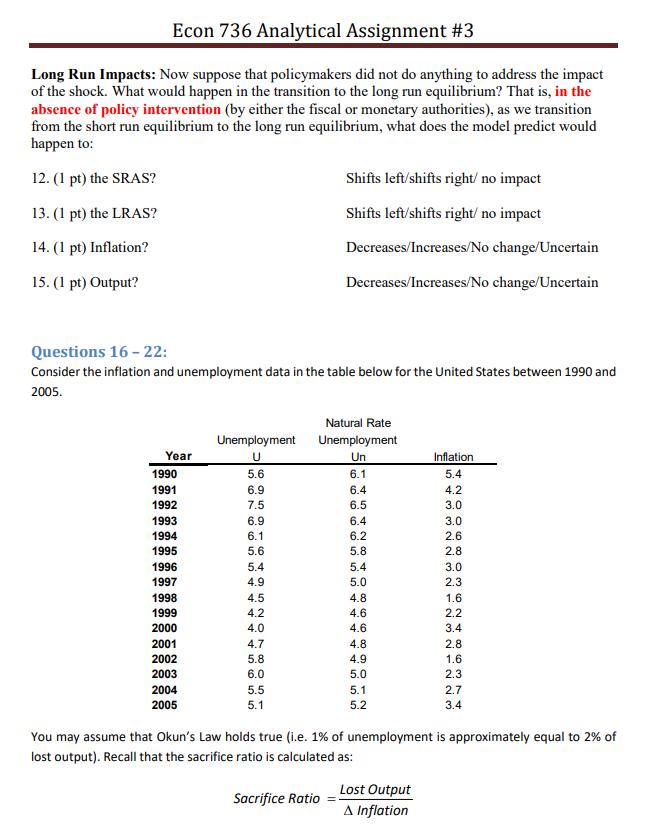
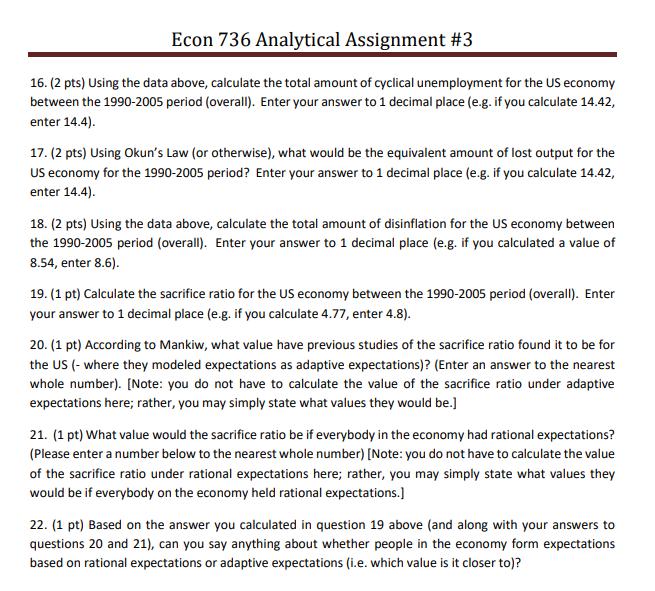
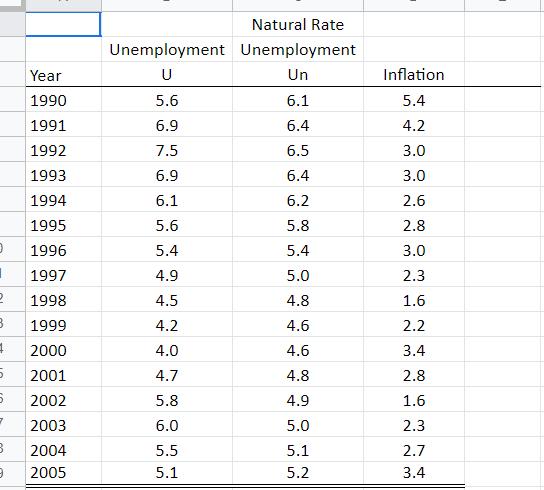
Consider the following statement: "A fiscal expansion will always reduce investment in an economy". Now consider the following "answer" to the question given by ChatGPT (a popular Al linguistics Chatbot): "This statement is false. A fiscal expansion, which refers to an increase in government spending or a decrease in taxes, can have a variety of effects on investment in an economy. It depends on the specific circumstances of the economy, as well as the way that the fiscal expansion is implemented. In some cases, a fiscal expansion can lead to an increase in investment. For example, if the fiscal expansion leads to an increase in consumer demand, firms may respond by increasing their investment in order to meet this demand. Additionally, if the fiscal expansion includes measures to increase the availability of credit, such as by lowering interest rates, this can also encourage investment by making it cheaper for firms to borrow money. On the other hand, a fiscal expansion can also lead to a decrease in investment in some cases. If the fiscal expansion leads to an increase in the government's budget deficit, this can create uncertainty about the government's future fiscal policy, which can discourage investment. Additionally, if the fiscal expansion leads to an increase in the supply of credit, this can lead to an increase in the competition for investment funds, which can lead to a decrease in investment. Overall, it is difficult to make a general statement about the effect of fiscal expansion on investment, as the specific circumstances of the economy and the details of the fiscal expansion will influence its impact." At first glance, the answer above may seem very reasonable. However, there are a number of issues with it. So, let's critique ChatGPT's answer. In the paragraph where it says "In some cases, a fiscal expansion can lead to an increase in investment.", within the first sentence following this statement, the Al is trying to argue that a fiscal expansion may increase consumption spending. 1. (1 pt) What is the mechanism by which that happens? [That is, utilize the IS-LM model to describe the variables in the model that would be impacted, and how they would end up increasing investment] 2. (2 pts) Given the mechanism you articulated in question 1, describe what is incorrect about this argument: that is, why a fiscal expansion leading to an increase in consumption may not in fact subsequently lead to an increase in investment. [Hint: it's missing a channel for how fiscal policy works within the IS-LM framework] Econ 736 Analytical Assignment #3 3. (1 pt) What assumption(s) would have to be true for a fiscal expansion that increases consumption, to increase investment at the end of the day? 4. (2pts) Now consider the last part of this second paragraph: "Additionally, if the fiscal expansion includes measures to increase the availability of credit, such as by lowering interest rates, this can also encourage investment by making it cheaper for firms to borrow money." Why is this statement totally incorrect? 5. (3 pts) In the paragraph where it says "... a fiscal expansion can also lead to a decrease in investment in some cases.", what does it get correct? What does it get incorrect? 6. (1 pt) Overall, was ChatGPT correct in stating that the answer is false? (YES/NO) Question 7: 7. (10 points) If the government wants to reduce the budget deficit, how can the central bank keep the economy from going into a recession? Using a single diagram, utilize the closed economy IS-LM model to graphically illustrate the impact of both the fiscal policy reducing the deficit and the monetary policy, which prevents output from falling. Be sure to label: i. the axes; ii. the curves; iii. the initial equilibrium point; iv. the direction the curves shift; and v. the terminal (final) equilibrium point. Questions 8-15: Using the AD/SRAS/LRAS model (with the sticky price version of the SRAS model), draw a diagram to graph the impact of the coronavirus (COVID-19) shock on the US economy. You may assume that you are starting at an initial long run equilibrium. Use your diagram to determine the answers to the following questions: (for each in the quiz, you will have to select from the following options: Immediate short run Impact: 8. (1 pt) What happens to the AD curve? 9. (1 pt) What happens to the SRAS curve? What does the model predict would happen to: 10. (2 pts) output in the short run? 11. (2 pts) prices (inflation) in the short run? Shifts left/shifts right/ no impact Shifts left/shifts right/ no impact Decreases/Increases/No change/Uncertain Decreases/Increases/No change/Uncertain Econ 736 Analytical Assignment #3 Long Run Impacts: Now suppose that policymakers did not do anything to address the impact of the shock. What would happen in the transition to the long run equilibrium? That is, in the absence of policy intervention (by either the fiscal or monetary authorities), as we transition from the short run equilibrium to the long run equilibrium, what does the model predict would happen to: 12. (1 pt) the SRAS? 13. (1 pt) the LRAS? 14. (1 pt) Inflation? 15. (1 pt) Output? Shifts left/shifts right/ no impact Shifts left/shifts right/ no impact Decreases/Increases/No change/Uncertain Decreases/Increases/No change/Uncertain Questions 16-22: Consider the inflation and unemployment data in the table below for the United States between 1990 and 2005. Natural Rate Unemployment Unemployment Year U Un Inflation 1990 5.6 6.1 5.4 1991 6.9 6.4 1992 7.5 1993 1994 1995 665 6.9 6.5 6.4 6.1 6.2 5.6 5.8 1996 5.4 5.4 +3320 2006 C 4542 4.2 3.0 3.0 2.6 2.8 3.0 1997 4.9 5.0 2.3 1998 4.5 4.8 1.6 1999 4.2 4.6 2.2 2000 4.0 4.6 3.4 2001 4.7 4.8 2.8. 2002 5.8 4.9 1.6 2003 6.0 5.0 2.3 2004 5.5 5.1 2.7 2005 5.1 5.2 3.4 You may assume that Okun's Law holds true (i.e. 1% of unemployment is approximately equal to 2% of lost output). Recall that the sacrifice ratio is calculated as: Lost Output Sacrifice Ratio = A Inflation Econ 736 Analytical Assignment #3 16. (2 pts) Using the data above, calculate the total amount of cyclical unemployment for the US economy between the 1990-2005 period (overall). Enter your answer to 1 decimal place (e.g. if you calculate 14.42, enter 14.4). 17. (2 pts) Using Okun's Law (or otherwise), what would be the equivalent amount of lost output for the US economy for the 1990-2005 period? Enter your answer to 1 decimal place (e.g. if you calculate 14.42, enter 14.4). 18. (2 pts) Using the data above, calculate the total amount of disinflation for the US economy between the 1990-2005 period (overall). Enter your answer to 1 decimal place (e.g. if you calculated a value of 8.54, enter 8.6). 19. (1 pt) Calculate the sacrifice ratio for the US economy between the 1990-2005 period (overall). Enter your answer to 1 decimal place (e.g. if you calculate 4.77, enter 4.8). 20. (1 pt) According to Mankiw, what value have previous studies of the sacrifice ratio found it to be for the US (- where they modeled expectations as adaptive expectations)? (Enter an answer to the nearest whole number). [Note: you do not have to calculate the value of the sacrifice ratio under adaptive expectations here; rather, you may simply state what values they would be.] 21. (1 pt) What value would the sacrifice ratio be if everybody in the economy had rational expectations? (Please enter a number below to the nearest whole number) [Note: you do not have to calculate the value of the sacrifice ratio under rational expectations here; rather, you may simply state what values they would be if everybody on the economy held rational expectations.] 22. (1 pt) Based on the answer you calculated in question 19 above (and along with your answers to questions 20 and 21), can you say anything about whether people in the economy form expectations based on rational expectations or adaptive expectations (i.e. which value is it closer to)? Natural Rate Unemployment Unemployment Year U Un Inflation 1990 5.6 6.1 5.4 1991 6.9 6.4 4.2 1992 7.5 6.5 3.0 1993 6.9 6.4 3.0 1994 6.1 6.2 2.6 1995 5.6 5.8 2.8 , 1996 5.4 5.4 3.0 1997 4.9 5.0 2.3 2 1998 4.5 4.8 1.6 3 1999 4.2 4.6 2.2 4 2000 4.0 4.6 3.4 5 2001 4.7 4.8 2.8 5 2002 5.8 4.9 1.6 2003 6.0 5.0 2.3 3 2004 5.5 5.1 2.7 9 2005 5.1 5.2 3.4 Consider the following statement: "A fiscal expansion will always reduce investment in an economy". Now consider the following "answer" to the question given by ChatGPT (a popular Al linguistics Chatbot): "This statement is false. A fiscal expansion, which refers to an increase in government spending or a decrease in taxes, can have a variety of effects on investment in an economy. It depends on the specific circumstances of the economy, as well as the way that the fiscal expansion is implemented. In some cases, a fiscal expansion can lead to an increase in investment. For example, if the fiscal expansion leads to an increase in consumer demand, firms may respond by increasing their investment in order to meet this demand. Additionally, if the fiscal expansion includes measures to increase the availability of credit, such as by lowering interest rates, this can also encourage investment by making it cheaper for firms to borrow money. On the other hand, a fiscal expansion can also lead to a decrease in investment in some cases. If the fiscal expansion leads to an increase in the government's budget deficit, this can create uncertainty about the government's future fiscal policy, which can discourage investment. Additionally, if the fiscal expansion leads to an increase in the supply of credit, this can lead to an increase in the competition for investment funds, which can lead to a decrease in investment. Overall, it is difficult to make a general statement about the effect of fiscal expansion on investment, as the specific circumstances of the economy and the details of the fiscal expansion will influence its impact." At first glance, the answer above may seem very reasonable. However, there are a number of issues with it. So, let's critique ChatGPT's answer. In the paragraph where it says "In some cases, a fiscal expansion can lead to an increase in investment.", within the first sentence following this statement, the Al is trying to argue that a fiscal expansion may increase consumption spending. 1. (1 pt) What is the mechanism by which that happens? [That is, utilize the IS-LM model to describe the variables in the model that would be impacted, and how they would end up increasing investment] 2. (2 pts) Given the mechanism you articulated in question 1, describe what is incorrect about this argument: that is, why a fiscal expansion leading to an increase in consumption may not in fact subsequently lead to an increase in investment. [Hint: it's missing a channel for how fiscal policy works within the IS-LM framework] Econ 736 Analytical Assignment #3 3. (1 pt) What assumption(s) would have to be true for a fiscal expansion that increases consumption, to increase investment at the end of the day? 4. (2pts) Now consider the last part of this second paragraph: "Additionally, if the fiscal expansion includes measures to increase the availability of credit, such as by lowering interest rates, this can also encourage investment by making it cheaper for firms to borrow money." Why is this statement totally incorrect? 5. (3 pts) In the paragraph where it says "... a fiscal expansion can also lead to a decrease in investment in some cases.", what does it get correct? What does it get incorrect? 6. (1 pt) Overall, was ChatGPT correct in stating that the answer is false? (YES/NO) Question 7: 7. (10 points) If the government wants to reduce the budget deficit, how can the central bank keep the economy from going into a recession? Using a single diagram, utilize the closed economy IS-LM model to graphically illustrate the impact of both the fiscal policy reducing the deficit and the monetary policy, which prevents output from falling. Be sure to label: i. the axes; ii. the curves; iii. the initial equilibrium point; iv. the direction the curves shift; and v. the terminal (final) equilibrium point. Questions 8-15: Using the AD/SRAS/LRAS model (with the sticky price version of the SRAS model), draw a diagram to graph the impact of the coronavirus (COVID-19) shock on the US economy. You may assume that you are starting at an initial long run equilibrium. Use your diagram to determine the answers to the following questions: (for each in the quiz, you will have to select from the following options: Immediate short run Impact: 8. (1 pt) What happens to the AD curve? 9. (1 pt) What happens to the SRAS curve? What does the model predict would happen to: 10. (2 pts) output in the short run? 11. (2 pts) prices (inflation) in the short run? Shifts left/shifts right/ no impact Shifts left/shifts right/ no impact Decreases/Increases/No change/Uncertain Decreases/Increases/No change/Uncertain Econ 736 Analytical Assignment #3 Long Run Impacts: Now suppose that policymakers did not do anything to address the impact of the shock. What would happen in the transition to the long run equilibrium? That is, in the absence of policy intervention (by either the fiscal or monetary authorities), as we transition from the short run equilibrium to the long run equilibrium, what does the model predict would happen to: 12. (1 pt) the SRAS? 13. (1 pt) the LRAS? 14. (1 pt) Inflation? 15. (1 pt) Output? Shifts left/shifts right/ no impact Shifts left/shifts right/ no impact Decreases/Increases/No change/Uncertain Decreases/Increases/No change/Uncertain Questions 16-22: Consider the inflation and unemployment data in the table below for the United States between 1990 and 2005. Natural Rate Unemployment Unemployment Year U Un Inflation 1990 5.6 6.1 5.4 1991 6.9 6.4 1992 7.5 1993 1994 1995 665 6.9 6.5 6.4 6.1 6.2 5.6 5.8 1996 5.4 5.4 +3320 2006 C 4542 4.2 3.0 3.0 2.6 2.8 3.0 1997 4.9 5.0 2.3 1998 4.5 4.8 1.6 1999 4.2 4.6 2.2 2000 4.0 4.6 3.4 2001 4.7 4.8 2.8. 2002 5.8 4.9 1.6 2003 6.0 5.0 2.3 2004 5.5 5.1 2.7 2005 5.1 5.2 3.4 You may assume that Okun's Law holds true (i.e. 1% of unemployment is approximately equal to 2% of lost output). Recall that the sacrifice ratio is calculated as: Lost Output Sacrifice Ratio = A Inflation Econ 736 Analytical Assignment #3 16. (2 pts) Using the data above, calculate the total amount of cyclical unemployment for the US economy between the 1990-2005 period (overall). Enter your answer to 1 decimal place (e.g. if you calculate 14.42, enter 14.4). 17. (2 pts) Using Okun's Law (or otherwise), what would be the equivalent amount of lost output for the US economy for the 1990-2005 period? Enter your answer to 1 decimal place (e.g. if you calculate 14.42, enter 14.4). 18. (2 pts) Using the data above, calculate the total amount of disinflation for the US economy between the 1990-2005 period (overall). Enter your answer to 1 decimal place (e.g. if you calculated a value of 8.54, enter 8.6). 19. (1 pt) Calculate the sacrifice ratio for the US economy between the 1990-2005 period (overall). Enter your answer to 1 decimal place (e.g. if you calculate 4.77, enter 4.8). 20. (1 pt) According to Mankiw, what value have previous studies of the sacrifice ratio found it to be for the US (- where they modeled expectations as adaptive expectations)? (Enter an answer to the nearest whole number). [Note: you do not have to calculate the value of the sacrifice ratio under adaptive expectations here; rather, you may simply state what values they would be.] 21. (1 pt) What value would the sacrifice ratio be if everybody in the economy had rational expectations? (Please enter a number below to the nearest whole number) [Note: you do not have to calculate the value of the sacrifice ratio under rational expectations here; rather, you may simply state what values they would be if everybody on the economy held rational expectations.] 22. (1 pt) Based on the answer you calculated in question 19 above (and along with your answers to questions 20 and 21), can you say anything about whether people in the economy form expectations based on rational expectations or adaptive expectations (i.e. which value is it closer to)? Natural Rate Unemployment Unemployment Year U Un Inflation 1990 5.6 6.1 5.4 1991 6.9 6.4 4.2 1992 7.5 6.5 3.0 1993 6.9 6.4 3.0 1994 6.1 6.2 2.6 1995 5.6 5.8 2.8 , 1996 5.4 5.4 3.0 1997 4.9 5.0 2.3 2 1998 4.5 4.8 1.6 3 1999 4.2 4.6 2.2 4 2000 4.0 4.6 3.4 5 2001 4.7 4.8 2.8 5 2002 5.8 4.9 1.6 2003 6.0 5.0 2.3 3 2004 5.5 5.1 2.7 9 2005 5.1 5.2 3.4
Expert Answer:

Related Book For 
Business Ethics Case Studies And Selected Readings
ISBN: 9780357453865
9th Edition
Authors: Marianne M. Jennings
Posted Date:
Students also viewed these economics questions
-
In your view, critically explain how the company that you have chosen would have established the driver approach to continuous improvement. your discussion should involve an applied understanding of...
-
Planning is one of the most important management functions in any business. A front office managers first step in planning should involve determine the departments goals. Planning also includes...
-
Read the case study "Southwest Airlines," found in Part 2 of your textbook. Review the "Guide to Case Analysis" found on pp. CA1 - CA11 of your textbook. (This guide follows the last case in the...
-
What would likely happen to long-run average cost at Oman's facility if engineers encountered difficulties in maintaining the facility's substantial daily volume of oil production? Explain.
-
The ascorbic acid concentration of five different brands of orange juice was measured. Six replicate samples of each brand were analyzed. The following partial ANOVA table was obtained. (a) Fill in...
-
Unless needed for screening purposes, why shouldn't demographic questions be asked up front in questionnaires?
-
The following questions deal with audits by public accounting firms. Select the best response for each question. a. Which of the following best describes why an independent auditor is asked to...
-
The Hoylake Rescue Squad receives an emergency call every 1, 2, 3, 4, 5, or 6 hours, according to the following probability distribution: Time Between emergency Probability Calls (hours) 1...
-
The matching principle requires that bad debts be treated as an expense in the year: the sale is made. the customer files bankruptcy. which the debt becomes six months past due. a court declares it...
-
Consider the Boolean function F given by F = A+ CD + (A+ D')(B' + D) (a) Convert F into sum of products. Explain clearly how you and include a screenshot of your implementation in your report....
-
Link Inc had net income for 2 0 2 0 totaling $ 5 0 0 , 0 0 0 , 0 0 0 . The company also had 1 5 0 , 0 0 0 , 0 0 0 shares of common stock that was outstanding for the full year. The company paid...
-
Woodside Manufacturing produces three types of knives: Modern,Classic and Fancy. The following information is available for each product. Modern Classic Fancy Direct material costper unit $2.00 $8.00...
-
I did an experiment during a class and need help answering questions. The Experiment: Two different groups one with the fidget one without fidget. To make a comparison of who would buy it ($2-$5) vs...
-
use dataset above for your project. Write short description of the dataset and what your CNN will recognize. Import the appropriate libraries: tensorflow, keras, numpy, glob, matplotlib,...
-
Luke Corporation produces a variety of products, each within their own division. Last year, the managers at Luke developed and began marketing a new chewing gum, Bubbs, to sell in vending machines....
-
You are given the initial state (a) and the goal state (b) of an 8-puzzle as shown below. 2 8 3 164 7 5 (a) 1 2 3 8 4 7 6 5 (b) a) Apply A* search using Manhattan distance heuristic function. Draw...
-
Consider a game of poker being played with a standard 52-card deck (four suits, each of which has 13 different denominations of cards). At a certain point in the game, six cards have been exposed. Of...
-
Search the Internet for the company MAX- IMA Group. List the main consequences of corporate fraud.
-
Using Google, determine the number of hits for these terms: a. Forensic accounting. b. Fraud auditing. c. Forensic auditing. d. Fraud examination.
-
Search the Internet: Is plagiarism fraud?

Study smarter with the SolutionInn App