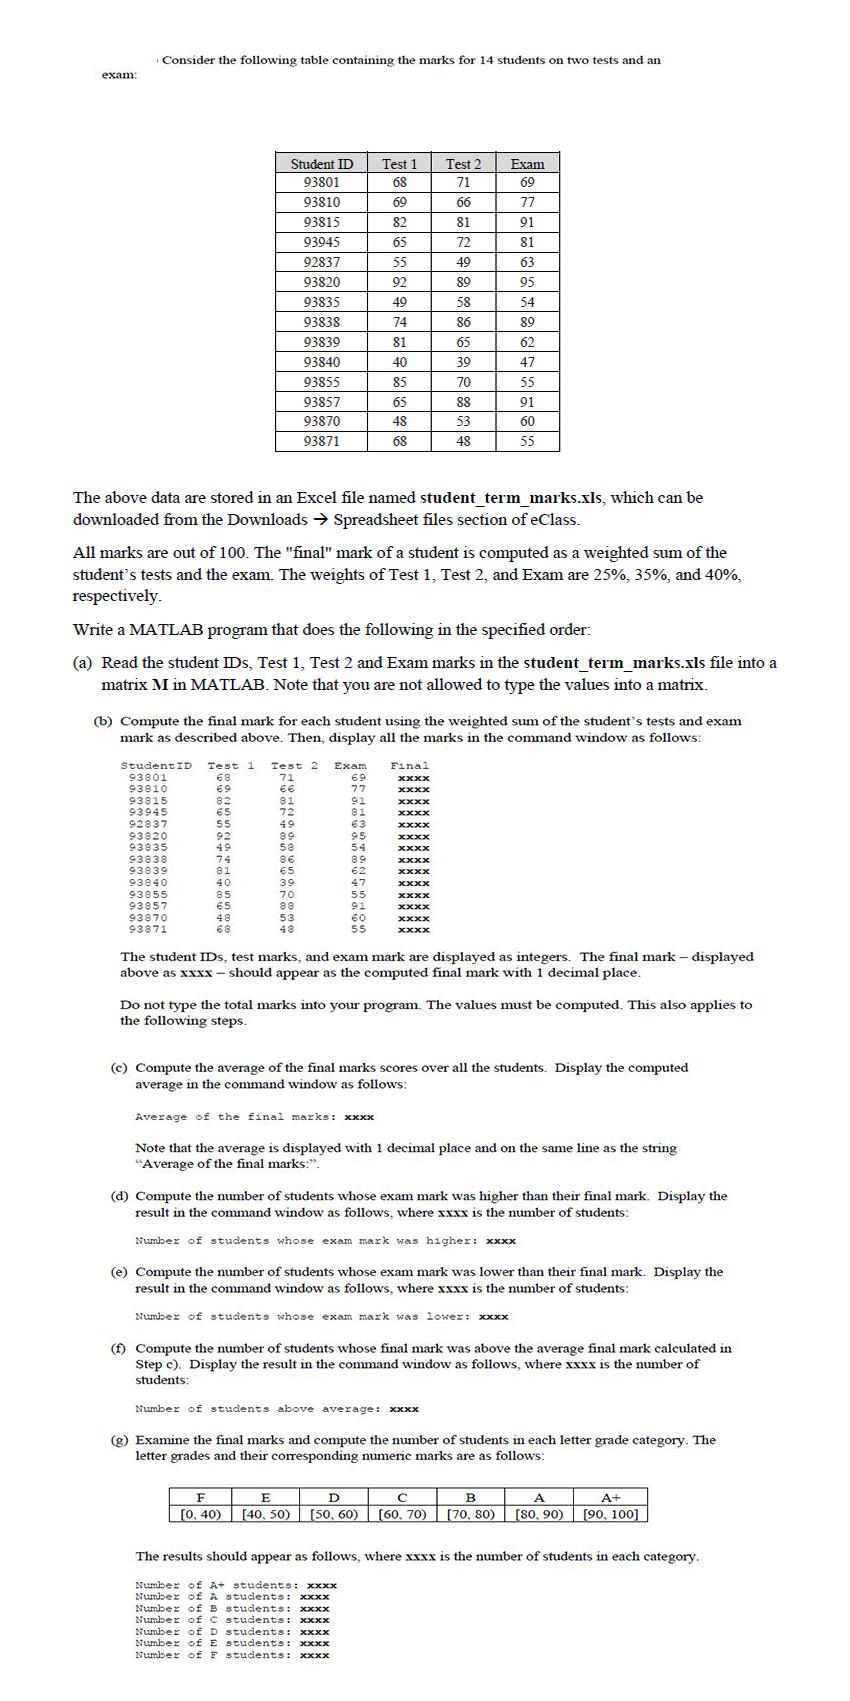
Consider the following table containing the marks for 14 students on two tests and an exam Test 1 68 69 Test 2 71 66 Exam 69 77 1 82 65 72 49 89 Student ID 93801 93810 93815 93945 92837 93820 93835 93838 93839 93840 93855 93857 93870 93871 55 92 49 74 91 81 63 95 54 89 58 86 81 65 39 70 40 85 65 48 68 62 47 55 91 60 55 88 53 48 The above data are stored in an Excel file named student_term_marks.xls, which can be downloaded from the Downloads Spreadsheet files section of eClass. All marks are out of 100. The "final" mark of a student is computed as a weighted sum of the student's tests and the exam. The weights of Test 1, Test 2, and Exam are 25%, 35%, and 40%, respectively. Write a MATLAB program that does the following in the specified order: (a) Read the student IDs, Test 1, Test 2 and Exam marks in the student_term_marks.xls file into a matrix M in MATLAB. Note that you are not allowed to type the values into a matrix. (b) Compute the final mark for each student using the weighted sum of the student's tests and exam mark as described above. Then, display all the marks in the command window as follows: Test 2 71 66 Test 1 68 69 82 65 55 Final xxxx xxxx XXXX Student ID 93801 93810 93815 93945 92837 93820 93835 93838 93839 93840 93855 93857 93870 93871 72 49 89 58 xxxx Exam 69 77 91 81 63 GS 54 89 62 47 55 92 60 74 81 40 85 65 48 68 69 39 70 88 53 48 xxxx xxxx xxxx xxxx XXXX xxxx XXXX xxxx The student IDs, test marks, and exam mark are displayed as integers. The final mark - displayed above as XXXX - should appear as the computed final mark with 1 decimal place. Do not type the total marks into your program. The values must be computed. This also applies to the following steps. (c) Compute the average of the final marks scores over all the students. Display the computed average in the command window as follows: Average of the final marks: XXXX Note that the average is displayed with 1 decimal place and on the same line as the string "Average of the final marks: (d) Compute the number of students whose exam mark was higher than their final mark. Display the result in the command window as follows, where xxxx is the number of students: Number of students whose exam mark was higher: xxxx (e) Compute the number of students whose exam mark was lower than their final mark. Display the result in the command window as follows, where xxxx is the number of students: Number of students whose exam mark was lower: xxxx (1) Compute the number of students whose final mark was above the average final mark calculated in Step c). Display the result in the command window as follows, where xxxx is the number of students: Number of students above average: xxxx (8) Examine the final marks and compute the number of students in each letter grade category. The letter grades and their corresponding numeric marks are as follows: F [O. 40) E [40, 50) D (50, 60) [60, 70) B [70, 80) A A+ [80, 90) (90, 100] The results should appear as follows, where xxxx is the number of students in each category. Number of A+ students: xxxx Number of A students: XXXX Number of students: xxxx Number of students: xxxx Number of students: XXXX Number of a students: xxxx Number of students: xxxx Consider the following table containing the marks for 14 students on two tests and an exam Test 1 68 69 Test 2 71 66 Exam 69 77 1 82 65 72 49 89 Student ID 93801 93810 93815 93945 92837 93820 93835 93838 93839 93840 93855 93857 93870 93871 55 92 49 74 91 81 63 95 54 89 58 86 81 65 39 70 40 85 65 48 68 62 47 55 91 60 55 88 53 48 The above data are stored in an Excel file named student_term_marks.xls, which can be downloaded from the Downloads Spreadsheet files section of eClass. All marks are out of 100. The "final" mark of a student is computed as a weighted sum of the student's tests and the exam. The weights of Test 1, Test 2, and Exam are 25%, 35%, and 40%, respectively. Write a MATLAB program that does the following in the specified order: (a) Read the student IDs, Test 1, Test 2 and Exam marks in the student_term_marks.xls file into a matrix M in MATLAB. Note that you are not allowed to type the values into a matrix. (b) Compute the final mark for each student using the weighted sum of the student's tests and exam mark as described above. Then, display all the marks in the command window as follows: Test 2 71 66 Test 1 68 69 82 65 55 Final xxxx xxxx XXXX Student ID 93801 93810 93815 93945 92837 93820 93835 93838 93839 93840 93855 93857 93870 93871 72 49 89 58 xxxx Exam 69 77 91 81 63 GS 54 89 62 47 55 92 60 74 81 40 85 65 48 68 69 39 70 88 53 48 xxxx xxxx xxxx xxxx XXXX xxxx XXXX xxxx The student IDs, test marks, and exam mark are displayed as integers. The final mark - displayed above as XXXX - should appear as the computed final mark with 1 decimal place. Do not type the total marks into your program. The values must be computed. This also applies to the following steps. (c) Compute the average of the final marks scores over all the students. Display the computed average in the command window as follows: Average of the final marks: XXXX Note that the average is displayed with 1 decimal place and on the same line as the string "Average of the final marks: (d) Compute the number of students whose exam mark was higher than their final mark. Display the result in the command window as follows, where xxxx is the number of students: Number of students whose exam mark was higher: xxxx (e) Compute the number of students whose exam mark was lower than their final mark. Display the result in the command window as follows, where xxxx is the number of students: Number of students whose exam mark was lower: xxxx (1) Compute the number of students whose final mark was above the average final mark calculated in Step c). Display the result in the command window as follows, where xxxx is the number of students: Number of students above average: xxxx (8) Examine the final marks and compute the number of students in each letter grade category. The letter grades and their corresponding numeric marks are as follows: F [O. 40) E [40, 50) D (50, 60) [60, 70) B [70, 80) A A+ [80, 90) (90, 100] The results should appear as follows, where xxxx is the number of students in each category. Number of A+ students: xxxx Number of A students: XXXX Number of students: xxxx Number of students: xxxx Number of students: XXXX Number of a students: xxxx Number of students: xxxx