Question
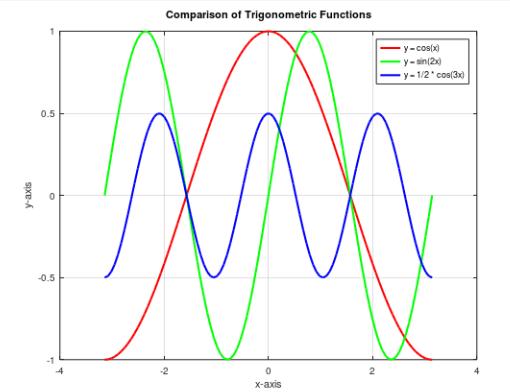
Consider the functions y-cos(x), y sin(2x), and y=21cos(3x). Use MATLAB to create a single plot that displays these functions within the domain -x. nalyze


Consider the functions y-cos(x), y sin(2x), and y=21cos(3x). Use MATLAB to create a single plot that displays these functions within the domain -x. nalyze and discuss the relationships and differences between the curves. Here example of plot. y-axis 0.5 O -0.5 Comparison of Trigonometric Functions 0 x-axis 2 y-cos(x) y-sin(2x) y-1/2* cos(3x)
Step by Step Solution
3.46 Rating (156 Votes )
There are 3 Steps involved in it
Step: 1
Creating a plot in MATLAB to visualize these functions See the following code x linspacepi pi 1000 y...
Get Instant Access to Expert-Tailored Solutions
See step-by-step solutions with expert insights and AI powered tools for academic success
Step: 2

Step: 3

Ace Your Homework with AI
Get the answers you need in no time with our AI-driven, step-by-step assistance
Get StartedRecommended Textbook for
System Dynamics
Authors: William Palm III
3rd edition
73398063, 978-0073398068
Students also viewed these Chemical Engineering questions
Question
Answered: 1 week ago
Question
Answered: 1 week ago
Question
Answered: 1 week ago
Question
Answered: 1 week ago
Question
Answered: 1 week ago
Question
Answered: 1 week ago
Question
Answered: 1 week ago
Question
Answered: 1 week ago
Question
Answered: 1 week ago
Question
Answered: 1 week ago
Question
Answered: 1 week ago
Question
Answered: 1 week ago
Question
Answered: 1 week ago
Question
Answered: 1 week ago
Question
Answered: 1 week ago
Question
Answered: 1 week ago
Question
Answered: 1 week ago
Question
Answered: 1 week ago
Question
Answered: 1 week ago
Question
Answered: 1 week ago
Question
Answered: 1 week ago
Question
Answered: 1 week ago
View Answer in SolutionInn App


