Answered step by step
Verified Expert Solution
Question
1 Approved Answer
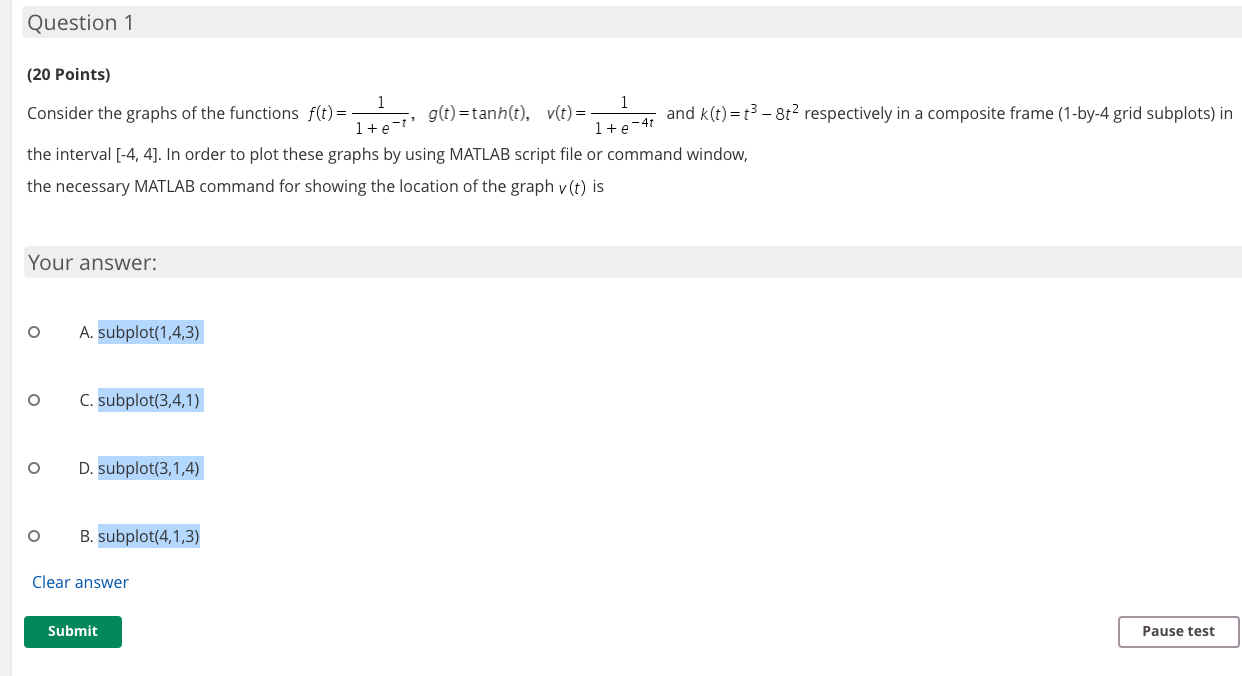
Consider the graphs of the functions and respectively in a composite frame (1-by-4 grid subplots) in the interval [-4, 4]. In order to plot these
 Consider the graphs of the functions and respectively in a composite frame (1-by-4 grid subplots) in the interval [-4, 4]. In order to plot these graphs by using MATLAB script file or command window,
the necessary MATLAB command for showing the location of the graph is
Question 1 (20 points) 1 1 Consider the graphs of the functions f(t)= and k(t)=t3 - 862 respectively in a composite frame (1-by-4 grid subplots) in 1+ e-p; g(t)=tanh(t), v(t)= 1+e-41 the interval [-4, 4]. In order to plot these graphs by using MATLAB script file or command window, the necessary MATLAB command for showing the location of the graph v(t) is Your answer: o A. subplot(1,4,3) o C. subplot(3,4,1) O D. subplot(3,1,4) o B. subplot(4,1,3) Clear answer Submit Pause testStep by Step Solution
There are 3 Steps involved in it
Step: 1

Get Instant Access to Expert-Tailored Solutions
See step-by-step solutions with expert insights and AI powered tools for academic success
Step: 2

Step: 3

Ace Your Homework with AI
Get the answers you need in no time with our AI-driven, step-by-step assistance
Get Started


