Answered step by step
Verified Expert Solution
Question
1 Approved Answer
Consider the relationship of CrimeRate (Y) with two independent variables: Wage (Xw) and Expenditure on police (XE). Develop separate simple linear regression models for

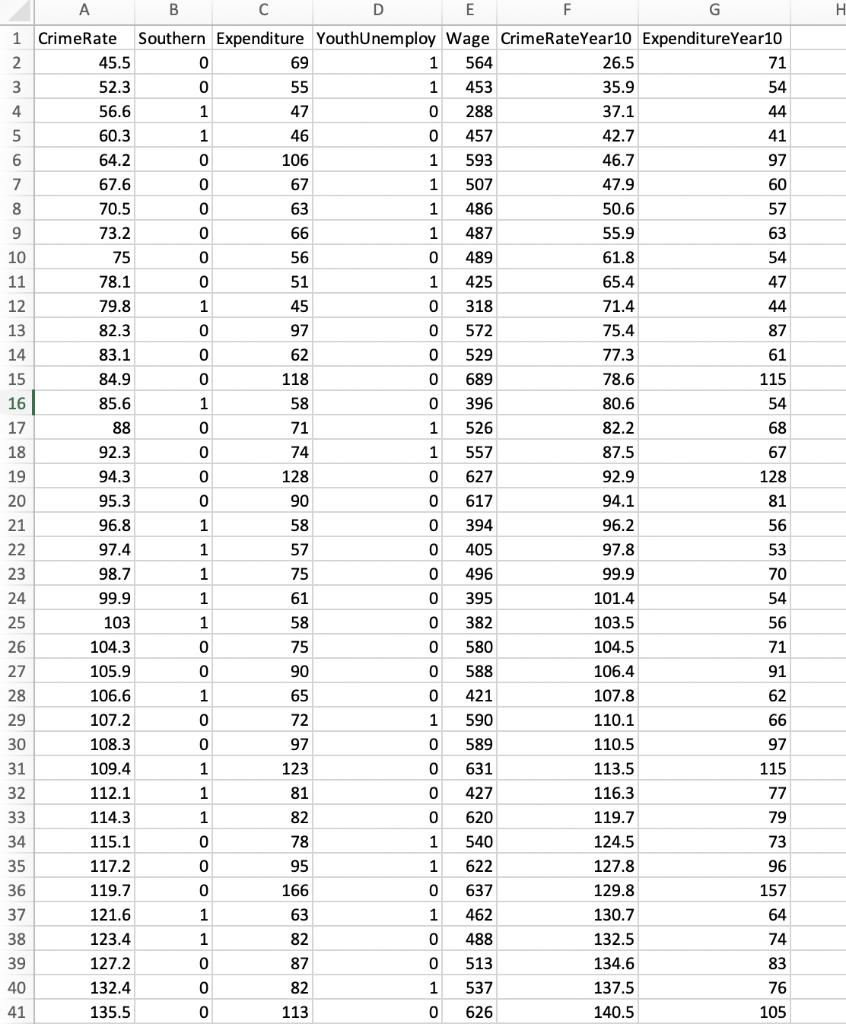

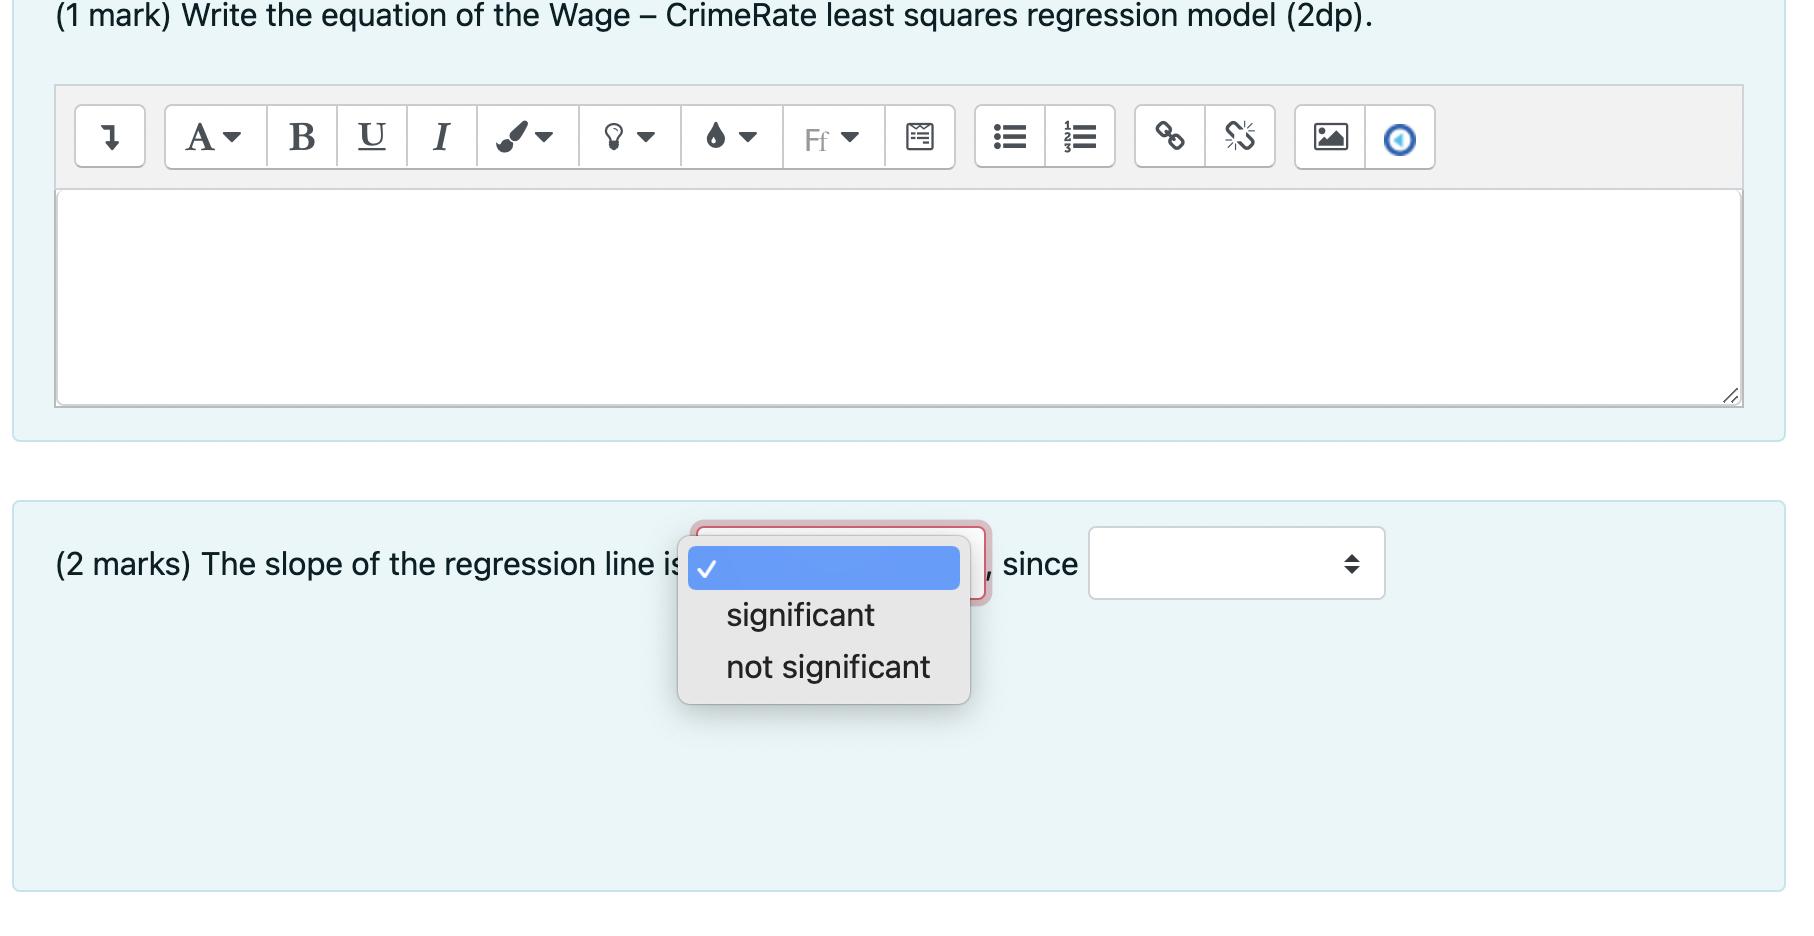
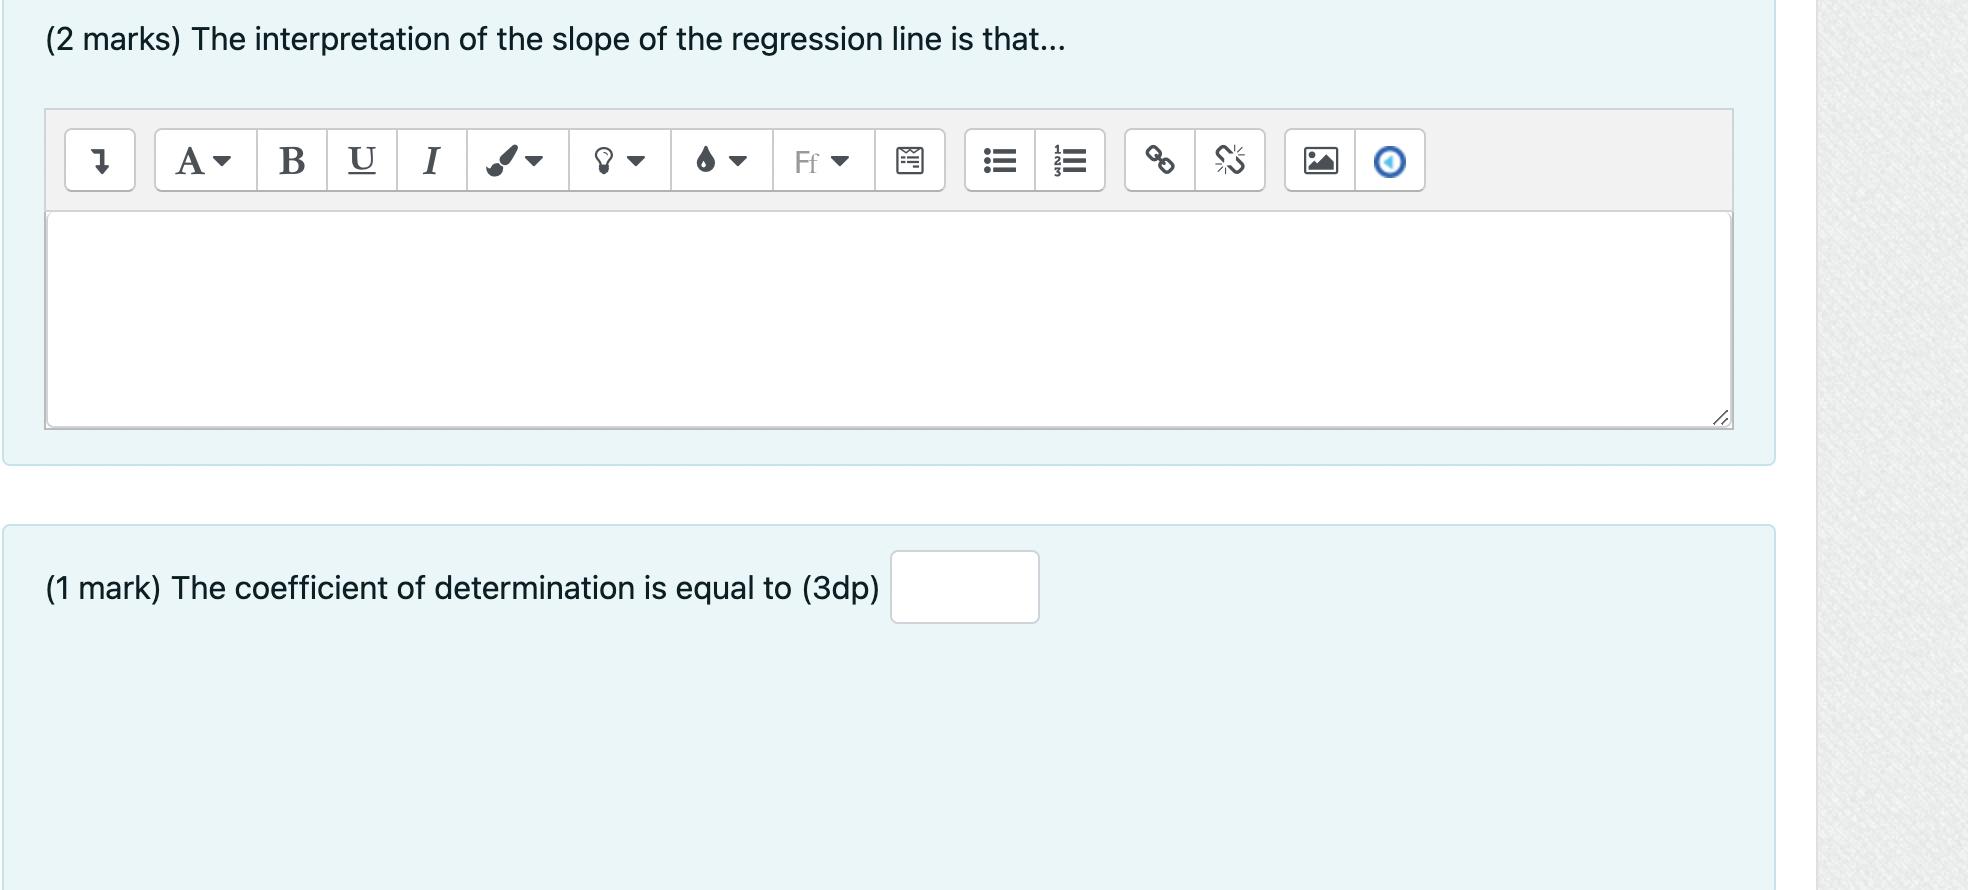
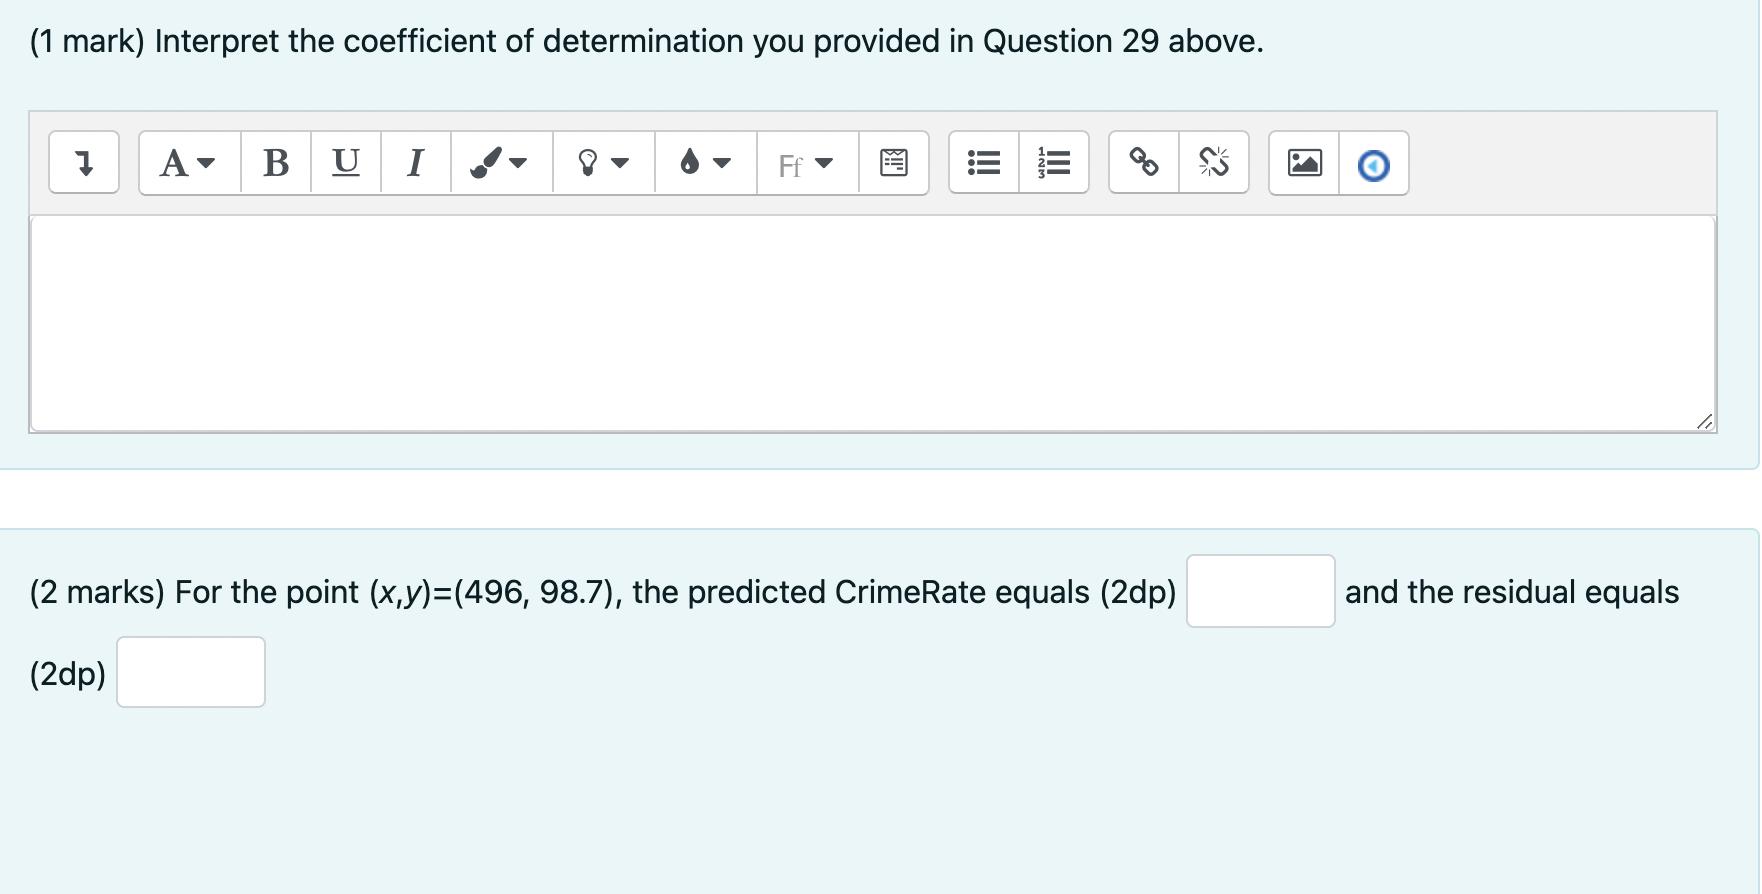
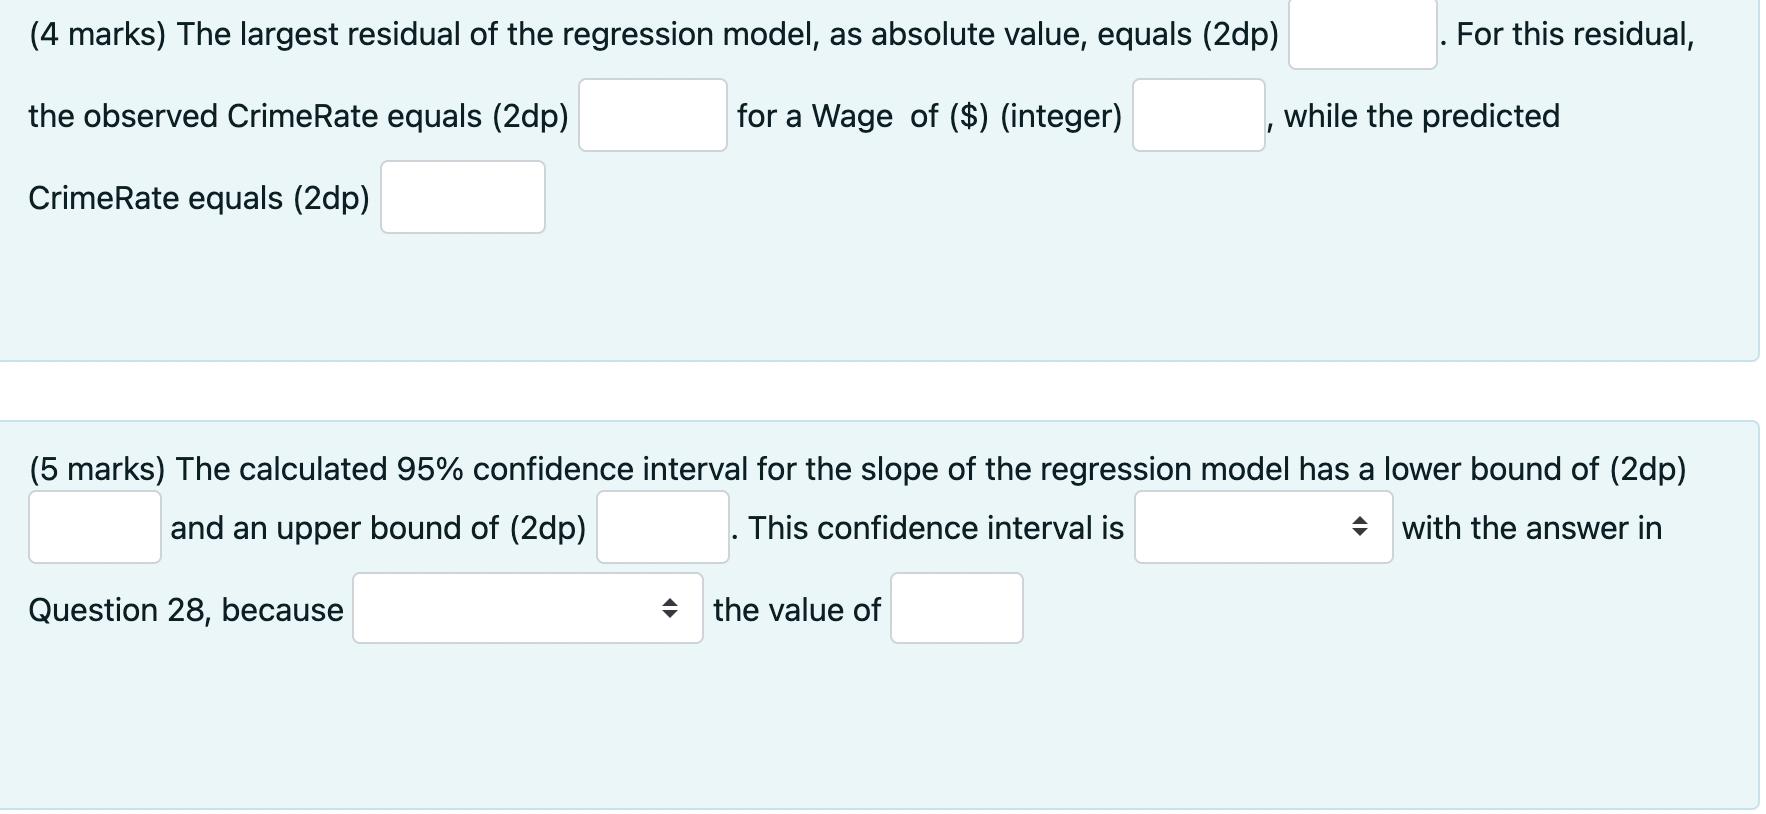
Consider the relationship of CrimeRate (Y) with two independent variables: Wage (Xw) and Expenditure on police (XE). Develop separate simple linear regression models for the relationships between Wage - CrimeRate and Expenditure - CrimeRate variables, and use these models to answer the following questions. Download and open the Exam.xlsx file in Excel. Use the Excel data, and any other information provided, to answer the following questions. A E F CrimeRate Southern Expenditure YouthUnemploy Wage CrimeRateYear10 ExpenditureYear10 45.5 69 1 564 26.5 71 3 52.3 55 1 453 35.9 54 4 56.6 1 47 288 37.1 44 60.3 1 46 457 42.7 41 64.2 106 593 46.7 97 67.6 67 1 507 47.9 60 8. 70.5 63 486 50.6 57 9 73.2 66 1 487 55.9 63 10 75 56 489 61.8 54 11 78.1 51 1 425 65.4 47 12 79.8 1 45 318 71.4 44 13 82.3 97 572 75.4 87 14 83.1 62 529 77.3 61 15 84.9 118 689 78.6 115 16 85.6 1 58 396 80.6 54 17 88 71 1 526 82.2 68 18 92.3 74 1 557 87.5 67 19 94.3 128 627 92.9 128 20 95.3 90 617 94.1 81 21 96.8 1 58 394 96.2 56 22 97.4 1 57 405 97.8 53 23 98.7 1 75 496 99.9 70 24 99.9 1 61 395 101.4 54 25 103 1 58 382 103.5 56 26 104.3 75 580 104.5 71 27 105.9 90 588 106.4 91 28 106.6 1 65 421 107.8 62 29 107.2 72 1 590 110.1 66 30 108.3 97 589 110.5 97 31 109.4 1 123 631 113.5 115 32 112.1 1 81 427 116.3 77 33 114.3 1 82 620 119.7 79 34 115.1 78 1 540 124.5 73 35 117.2 95 1 622 127.8 96 36 119.7 166 637 129.8 157 37 121.6 1 63 1 462 130.7 64 38 123.4 1 82 488 132.5 74 39 127.2 87 513 134.6 83 40 132.4 82 1 537 137.5 76 41 135.5 113 626 140.5 105 42 137.8 109 1 578 145.7 101 43 140.8 109 559 150.6 98 44 145.4 1 115 472 157.3 109 45 149.3 103 557 162.7 95 46 154.3 121 657 169.6 116 47 157.7 149 673 177.2 141 48 161.8 160 674 178.2 143 49 50 51 (1 mark) Write the equation of the Wage - CrimeRate least squares regression model (2dp). A B U I Ff (2 marks) The slope of the regression line is since significant not significant III !! (2 marks) The interpretation of the slope of the regression line is that... A- B U I Ff (1 mark) The coefficient of determination is equal to (3dp) II !! (1 mark) Interpret the coefficient of determination you provided in Question 29 above. U I Ff (2 marks) For the point (x,y)=(496, 98.7), the predicted CrimeRate equals (2dp) and the residual equals (2dp) II !! (4 marks) The largest residual of the regression model, as absolute value, equals (2dp) For this residual, the observed CrimeRate equals (2dp) for a Wage of ($) (integer) while the predicted CrimeRate equals (2dp) (5 marks) The calculated 95% confidence interval for the slope of the regression model has a lower bound of (2dp) and an upper bound of (2dp) .This confidence interval is + with the answer in Question 28, because the value of
Step by Step Solution
★★★★★
3.61 Rating (151 Votes )
There are 3 Steps involved in it
Step: 1
Solution The following information has been provided Sample Mean 1 X1 90935484 Sample Standard Devia...
Get Instant Access to Expert-Tailored Solutions
See step-by-step solutions with expert insights and AI powered tools for academic success
Step: 2

Step: 3

Ace Your Homework with AI
Get the answers you need in no time with our AI-driven, step-by-step assistance
Get Started


