Answered step by step
Verified Expert Solution
Question
1 Approved Answer
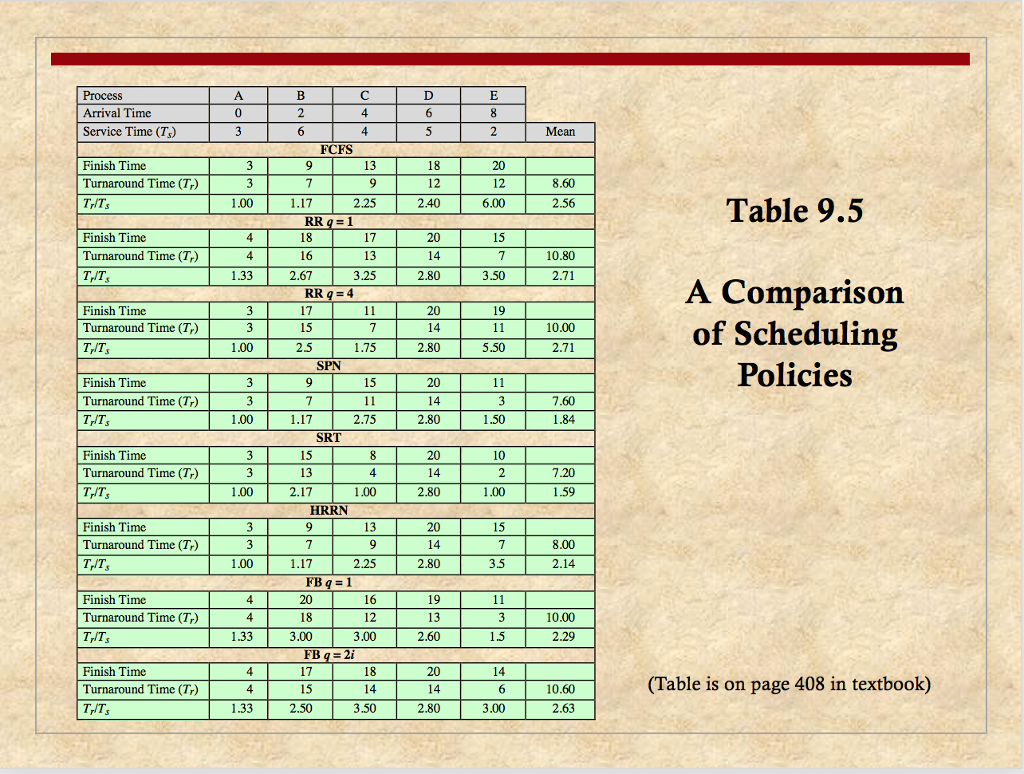
Consider the set of processes in Problem 9.2 on page 429. Perform the Analysis as shown in Figure 9.5 (page 407) for FCFS, Round-robin q=1
Consider the set of processes in Problem 9.2 on page 429. Perform the Analysis as shown in Figure 9.5 (page 407) for FCFS, Round-robin q=1 and SRT.
I need to figure out the analysis for this graph.

This is figure 4.2 for the list of processes.

EDIT: I just need to do the finish time at the last cell that are blank for the finish time.
Process TA BTCTD TED Arrival Time 0 2468 Service Time (T, 3 Mean FCFS Finish Time 3 9 13 18 20 T O Turnaround Time (T,379 T12 128 TNT 100 1172.25 240 .00 256 Table 9.5 . A Comparison of Scheduling Policies Finish Time T418 T17 T20 15 Turnaround Time (T) 41613 14 11080 T IT, 1.33 2.67 3.25 280 3.50 2.71 RR 9 = 4 Finish Time T317 T11 T20 19 TD Turnaround Time (T, 315 714 111000 T IT, T100 T25 T175 T280 T550 T271 SPN Finish Time 39 T15 T20 11 TD Turnaround Time (Tr) 37 1114 .60 TIT, 1.00 1172.75 2.80 1.50 1.84 SRT Finish Time T315 8 T20 T10 TD Turnaround Time (T,) 313 4142 120 TIT, 100 2.17 100 2.80 1.00 159 I HRRN Finish Time 3 9 13 2015 TO Turnaround Time (T, 319 14 .00 T IT 100 1172.80 352 FBq =1 Finish Time 420 1619 11 TO Turnaround Time (T,) 418 1213 31000 TIT, 133 300 3.00 260 $ 229 FB q= 2i Finish Time 417 18 2014 TO Turnaround Time (T) 415 14 146 10.60 (Table is on page 408 in textbook) TsIT 1332. 50 3.50 280 .00 263Step by Step Solution
There are 3 Steps involved in it
Step: 1

Get Instant Access to Expert-Tailored Solutions
See step-by-step solutions with expert insights and AI powered tools for academic success
Step: 2

Step: 3

Ace Your Homework with AI
Get the answers you need in no time with our AI-driven, step-by-step assistance
Get Started


