

Answered step by step
Verified Expert Solution
Question
1 Approved Answer
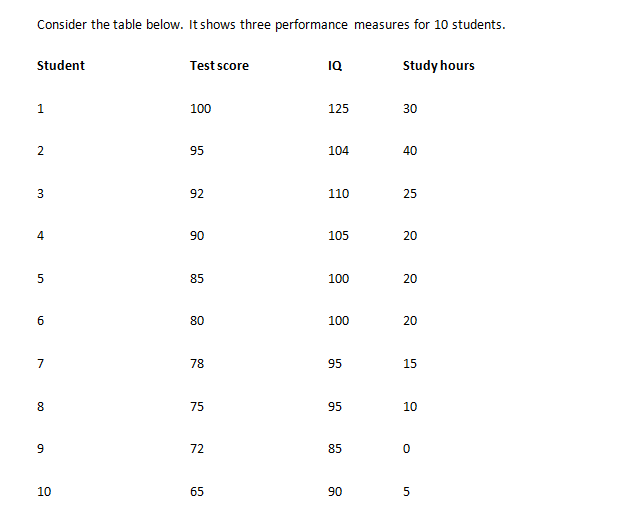
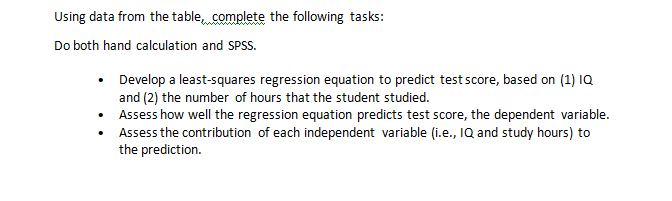
Consider the table below. It shows three performance measures for 10 students. Student Test score IQ Study hours 100 125 30 95 104 40 92


Step by Step Solution
There are 3 Steps involved in it
Step: 1

Get Instant Access to Expert-Tailored Solutions
See step-by-step solutions with expert insights and AI powered tools for academic success
Step: 2

Step: 3
Ace Your Homework with AI
Get the answers you need in no time with our AI-driven, step-by-step assistance
Get Started
Partial Differential Equations For Scientists And Engineers
Authors: Stanley J Farlow
1st Edition
0486134733, 9780486134734