

Answered step by step
Verified Expert Solution
Question
1 Approved Answer
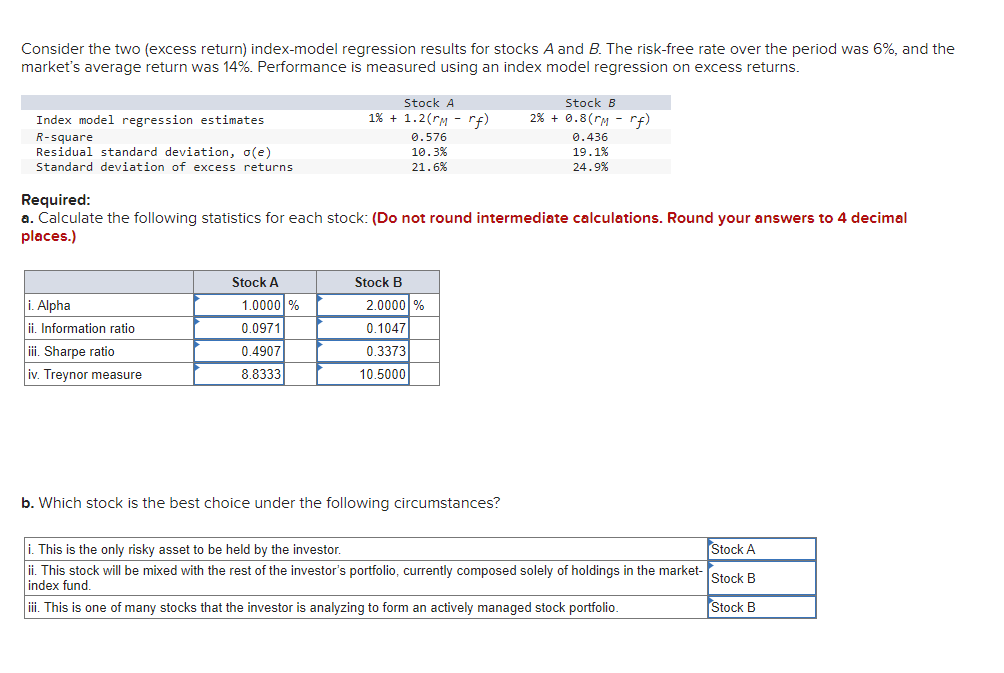
Consider the two (excess return) index-model regression results for stocks A and B. The risk-free rate over the period was 6%, and the market's average
Step by Step Solution
There are 3 Steps involved in it
Step: 1

Get Instant Access to Expert-Tailored Solutions
See step-by-step solutions with expert insights and AI powered tools for academic success
Step: 2

Step: 3
Ace Your Homework with AI
Get the answers you need in no time with our AI-driven, step-by-step assistance
Get Started
The Handbook Of The Economics Of Corporate Governance Volume 1
Authors: Benjamin Hermalin , Michael Weisbach
1st Edition
0444635300,0444635408