

Answered step by step
Verified Expert Solution
Question
1 Approved Answer
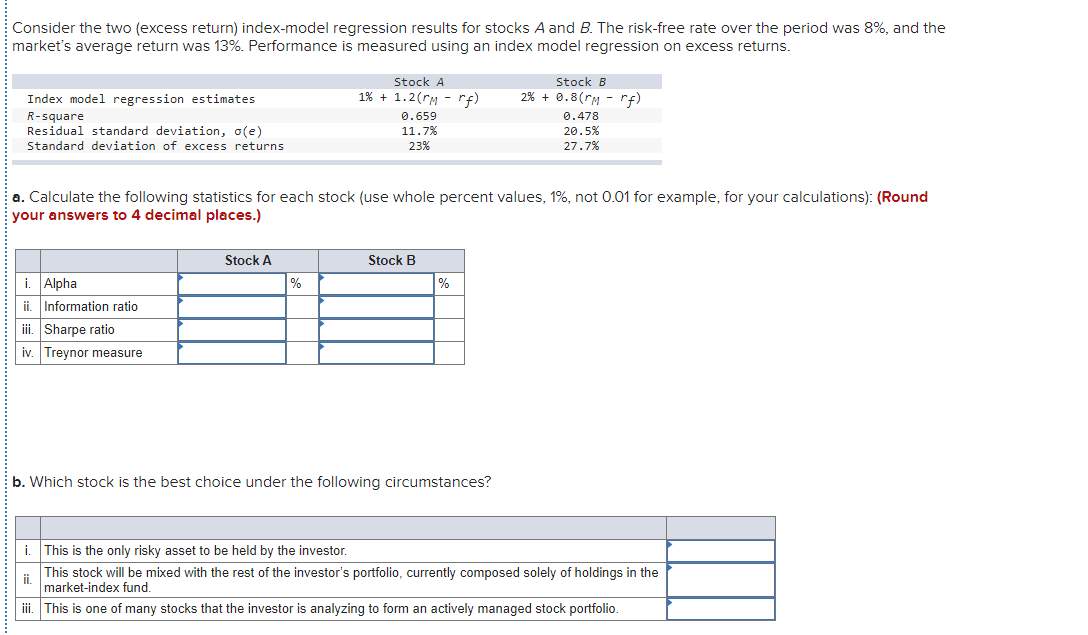
Consider the two (excess return) index-model regression results for stocks A and B. The risk-free rate over the period was 8%, and the market's average
Step by Step Solution
There are 3 Steps involved in it
Step: 1

Get Instant Access to Expert-Tailored Solutions
See step-by-step solutions with expert insights and AI powered tools for academic success
Step: 2

Step: 3
Ace Your Homework with AI
Get the answers you need in no time with our AI-driven, step-by-step assistance
Get Started
Introduction To Derivatives And Risk Management
Authors: Robert Brooks, Don M Chance, Roberts Brooks
8th Edition
0324601212, 9780324601213