

Question
Considering above Data compare air Asia to other competitors in the picture Revenue Net profit /loss Operating expenses From 2017 to 2021 Benchmark the highlights
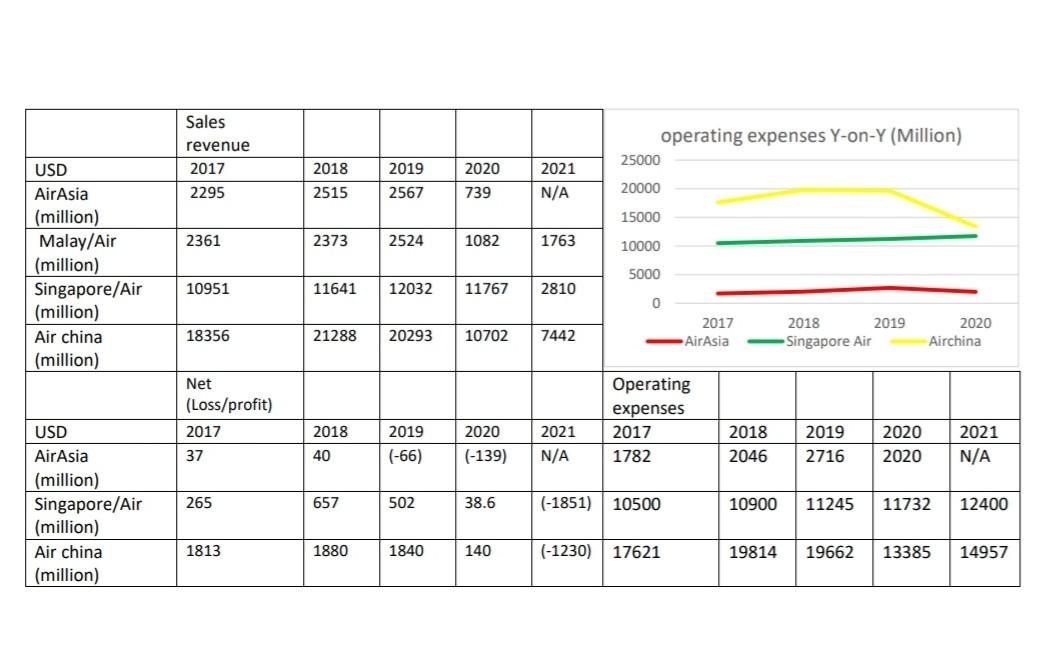
Considering above Data compare air Asia to other competitors in the picture
Revenue Net profit /loss Operating expenses
From 2017 to 2021
Benchmark the highlights from 2017-2021 And mention how air Asia performed compare to other competitors
USD AirAsia (million) Malay/Air (million) Singapore/Air (million) Air china (million) USD AirAsia (million) Singapore/Air (million) Air china (million) Sales revenue 2017 2295 2361 10951 18356 Net (Loss/profit) 2017 37 265 1813 2018 2019 2020 2515 2567 739 2373 2524 1082 11641 12032 11767 21288 20293 10702 2018 2019 2020 40 (-66) (-139) 657 502 38.6 1880 1840 140 operating expenses Y-on-Y (Million) 2018 2019 2020 Singapore Air 2018 2020 2019 2046 2716 2020 10900 11245 11732 19814 19662 13385 25000 2021 20000 N/A 15000 1763 10000 5000 2810 0 7442 Operating expenses 2021 2017 N/A 1782 (-1851) 10500 (-1230) 17621 2017 AirAsia Airchina 2021 N/A 12400 14957Step by Step Solution
There are 3 Steps involved in it
Step: 1

Get Instant Access to Expert-Tailored Solutions
See step-by-step solutions with expert insights and AI powered tools for academic success
Step: 2

Step: 3
Ace Your Homework with AI
Get the answers you need in no time with our AI-driven, step-by-step assistance
Get Started
Public Finance And Public Policy
Authors: Jonathan Gruber
7th Edition
1319281109, 9781319281106