- Considering Coopers financial conditions, should it acquire Champion Spark Plugs? (You should consider both qualitative and quantitative factors)
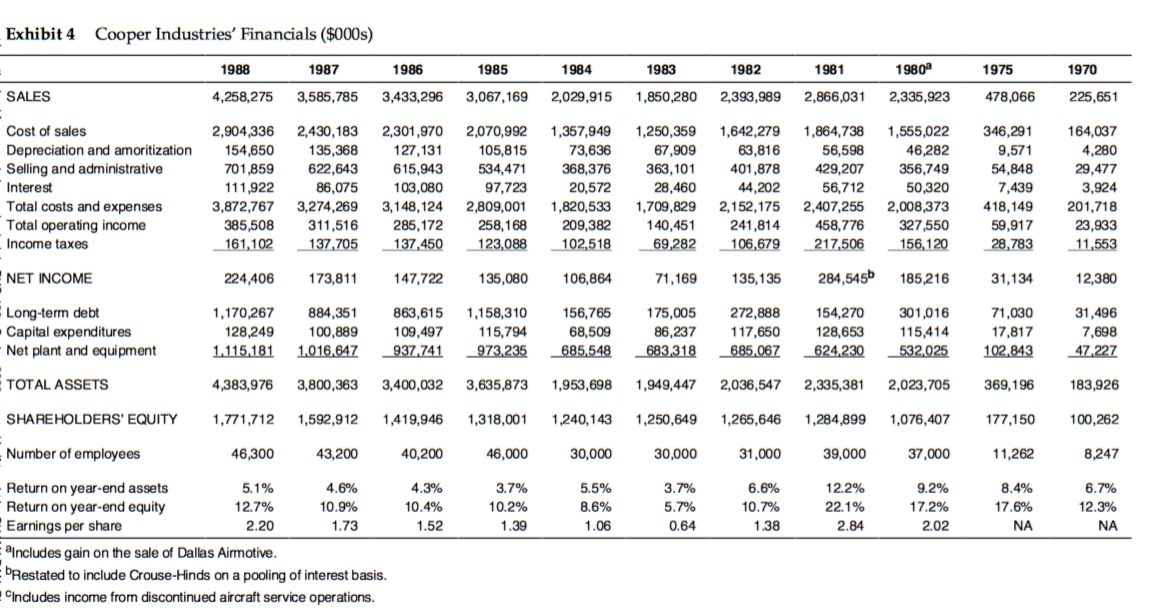
Exhibit 4 Cooper Industries' Financials ($000s) 1986 1985 1984 1980 1975 1988 4,258,275 1987 3,585,785 1983 1,850,280 1982 2,393,989 1981 2,866,031 1970 225,651 SALES 3,433,296 3,067,1692,029,915 2,335,923 478,066 Cost of sales Depreciation and amoritization -Selling and administrative Interest Total costs and expenses Total operating income Income taxes 2,904,336 154,650 701,859 111,922 3,872,767 385,508 161,102 2,430,183 135,368 622,643 86,075 3,274,269 311,516 137,705 2,301,970 127, 131 615,943 103,080 3,148,124 285,172 137,450 2,070,992 105,815 534,471 97,723 2,809,001 258,168 123,088 1,357,949 73,636 368,376 20,572 1,820,533 209,382 102,518 1,250,359 1,642,279 67,909 63,816 363,101 401,878 28,460 44,202 1,709,8292,152,175 140,451 241,814 69,282 106,679 1,864,738 56,598 429,207 56,712 2,407,255 458,776 217,506 1,555,022 46,282 356,749 50,320 2,008,373 327,550 156,120 346,291 9,571 54,848 7 ,439 418,149 59,917 28,783 164,037 4,280 29,477 3,924 201,718 23,933 11,553 NET INCOME 224,406 173,811 147,722 135,080 106,864 71,169 135,135 284,545b 185,216 31,134 12,380 Long-term debt - Capital expenditures -Net plant and equipment 1,170,267 128,249 1,115,181 884,351 100,889 1,016,647 863,615 109,497 937,741 1,158,310 115,794 973,235 156,765 68,509 685,548 175,005 86,237 683,318 272,888 117,650 685,067 154,270 128,653 624,230 301,016 115,414 532,025 71,030 17,817 102.843 31,496 7,698 47,227 TOTAL ASSETS 4,383,976 3,800,363 3,400,032 3,635,8731,953,698 1,949,447 2,036,547 2,335,381 2,023,705 369,196 183,926 SHAREHOLDERS' EQUITY 1,771,712 1,592,912 1,419,946 1,318,001 1,240,143 1,250,649 1,265,646 1,284,899 1,076,407 177,150 100,262 Number of employees 46,300 43,200 40,200 46,000 30,000 30,000 31,000 39,000 37,000 11,262 8,247 4.3% 10.4% 1.52 3.7% 10.2% 1.39 5.5% 8.6% 1.06 3.7% 5.7% 0.64 6.6% 10.7% 1.38 12.2% 22.1% 2.84 9.2% 17.2% .02 8.4% 17.6% NA 6.7% 12.3% NA 2 - Return on year-end assets 5.1% 4.6% Return on year-end equity 12.7% 10.9% Earnings per share 2.20 1.73 includes gain on the sale of Dallas Airmotive. Restated to include Crouse-Hinds on a pooling of interest basis. Includes income from discontinued aircraft service operations Exhibit 4 Cooper Industries' Financials ($000s) 1986 1985 1984 1980 1975 1988 4,258,275 1987 3,585,785 1983 1,850,280 1982 2,393,989 1981 2,866,031 1970 225,651 SALES 3,433,296 3,067,1692,029,915 2,335,923 478,066 Cost of sales Depreciation and amoritization -Selling and administrative Interest Total costs and expenses Total operating income Income taxes 2,904,336 154,650 701,859 111,922 3,872,767 385,508 161,102 2,430,183 135,368 622,643 86,075 3,274,269 311,516 137,705 2,301,970 127, 131 615,943 103,080 3,148,124 285,172 137,450 2,070,992 105,815 534,471 97,723 2,809,001 258,168 123,088 1,357,949 73,636 368,376 20,572 1,820,533 209,382 102,518 1,250,359 1,642,279 67,909 63,816 363,101 401,878 28,460 44,202 1,709,8292,152,175 140,451 241,814 69,282 106,679 1,864,738 56,598 429,207 56,712 2,407,255 458,776 217,506 1,555,022 46,282 356,749 50,320 2,008,373 327,550 156,120 346,291 9,571 54,848 7 ,439 418,149 59,917 28,783 164,037 4,280 29,477 3,924 201,718 23,933 11,553 NET INCOME 224,406 173,811 147,722 135,080 106,864 71,169 135,135 284,545b 185,216 31,134 12,380 Long-term debt - Capital expenditures -Net plant and equipment 1,170,267 128,249 1,115,181 884,351 100,889 1,016,647 863,615 109,497 937,741 1,158,310 115,794 973,235 156,765 68,509 685,548 175,005 86,237 683,318 272,888 117,650 685,067 154,270 128,653 624,230 301,016 115,414 532,025 71,030 17,817 102.843 31,496 7,698 47,227 TOTAL ASSETS 4,383,976 3,800,363 3,400,032 3,635,8731,953,698 1,949,447 2,036,547 2,335,381 2,023,705 369,196 183,926 SHAREHOLDERS' EQUITY 1,771,712 1,592,912 1,419,946 1,318,001 1,240,143 1,250,649 1,265,646 1,284,899 1,076,407 177,150 100,262 Number of employees 46,300 43,200 40,200 46,000 30,000 30,000 31,000 39,000 37,000 11,262 8,247 4.3% 10.4% 1.52 3.7% 10.2% 1.39 5.5% 8.6% 1.06 3.7% 5.7% 0.64 6.6% 10.7% 1.38 12.2% 22.1% 2.84 9.2% 17.2% .02 8.4% 17.6% NA 6.7% 12.3% NA 2 - Return on year-end assets 5.1% 4.6% Return on year-end equity 12.7% 10.9% Earnings per share 2.20 1.73 includes gain on the sale of Dallas Airmotive. Restated to include Crouse-Hinds on a pooling of interest basis. Includes income from discontinued aircraft service operations