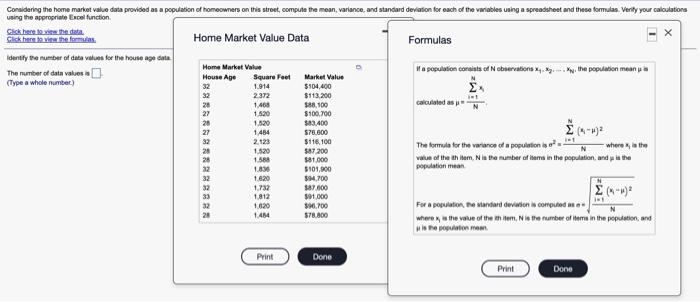
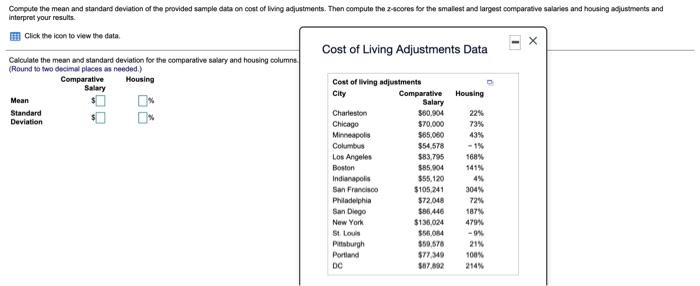
Considering the home market value data provided as a population of homeowners on this street compute the moon, varlance, and standard deviation for each of the variables using a spreadsheet and these formulas. Verify your calculators Click here to view the data Click here to view the form Home Market Value Data Formulas Identify the number of data value for the house age data The number of data values Home Market Value a population consts of observations ... the population meanya (Type a whole number) House Age Square Feet Market Value 32 1.914 $104,400 32 2372 $113,200 1.461 $88.100 calculated as 27 1.520 $100.700 20 1.520 $83.400 1.484 576.600 (1-1) 2.123 $116.100 The formula for the orice la population is 1 1.520 where the 587.200 1.580 $81.000 value of the them, Ninthe number of items in the population and in the 1.83 $101.000 population mean 1.620 $14.700 $87.000 1.812 391.000 (1-1) 1.620 990.700 For a population, the standard deviation is compued me 1.454 378.800 where a the value of the item is the number of them in the population and NRRRRRRR 1.732 Print Done Print Done Compute the mean and standard deviation of the provided sample data on cost of living adjustments. Then compute the 2-scores for the smallest and largest comparative salaries and housing ajustments and Interpret your results. Click the icon to view the data Cost of Living Adjustments Data Calculate the mean and standard deviation for the comparative salary and housing columns (Round to two decimal places as needed.) Comparative Housing Salary Cost of living adjustments Mean City Comparative Housing Salary Standard Charleston 560.904 22% Deviation Chicago $70.000 73% Minneapolis $65.080 43% Columbus $54,578 - 1% Los Angeles $83.795 168% Boston $85.904 Indianapolis $55,120 4% San Francisco $105,241 304% Philadelphia 372.048 San Diego $11.446 187% New York $136.024 479% St Louis $56,054 -99 Pittsburgh $50,578 21% Portland $77 10 100% DC $87.32 214% 72%