

Answered step by step
Verified Expert Solution
Question
1 Approved Answer
Consolidated Balance Sheets - USD ($) $ in Millions Current assets: Cash and cash equivalents Marketable securities Inventories Accounts receivable, net and other Total current
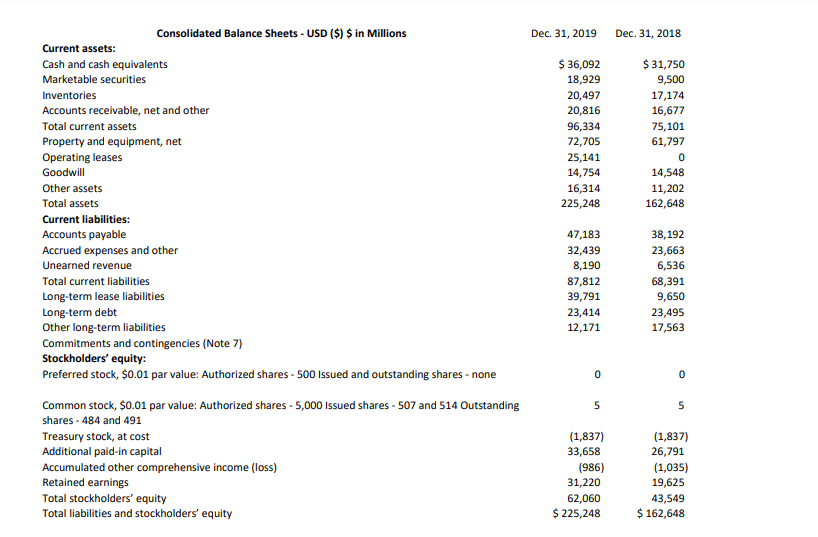
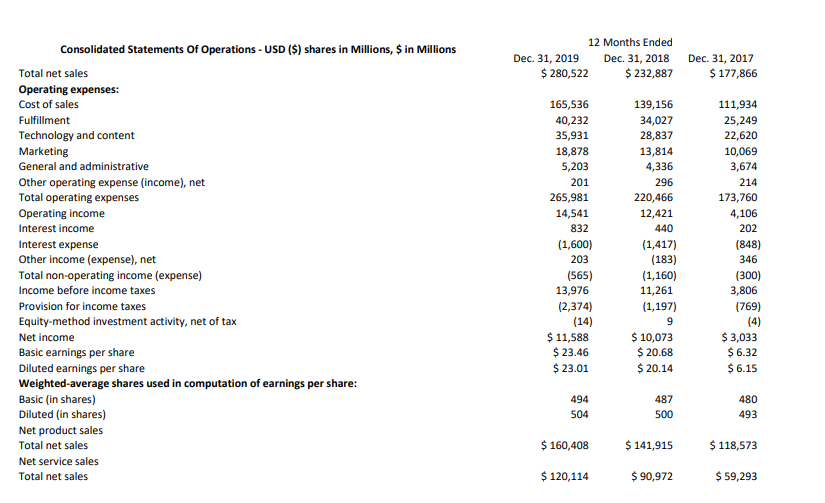
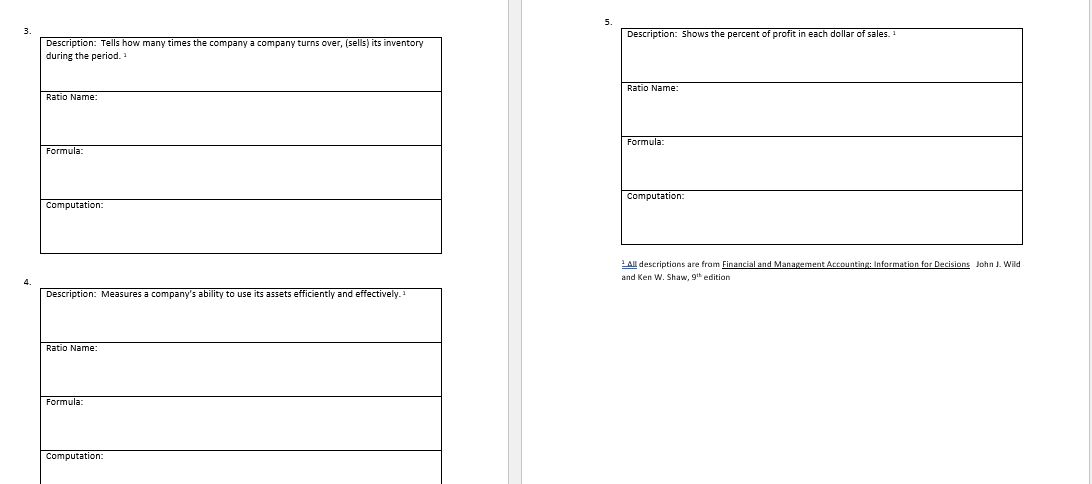 Consolidated Balance Sheets - USD (\$) \$ in Millions Current assets: Cash and cash equivalents Marketable securities Inventories Accounts receivable, net and other Total current assets Property and equipment, net Operating leases Goodwill Other assets Total assets Current liabilities: Accounts payable Accrued expenses and other Unearned revenue Total current liabilities Long-term lease liabilities Long-term debt Other long-term liabilities Commitments and contingencies (Note 7) Stockholders' equity: Preferred stock, \$0.01 par value: Authorized shares - 500 Issued and outstanding shares - none Common stock, \$0.01 par value: Authorized shares - 5,000 Issued shares - 507 and 514 Outstanding shares - 484 and 491 Treasury stock, at cost Additional paid-in capital Accumulated other comprehensive income (loss) Retained earnings Total stockholders' equity Total liabilities and stockholders' equity Dec. 31, 2019 $36,09218,92920,49720,81696,33472,70525,14114,75416,314225,24847,18332,4398,19087,81239,79123,41412,171$31,7509,50017,17416,67775,10161,797014,54811,202162,64838,19223,6636,53668,3919,65023,49517,563 0 5 (1,837) 33,658 (986) 31,220 62,060 $225,248 Dec. 31, 2018 $31,7509,50017,17416,67775,10161,797014,54811,202162,64838,19223,6636,53668,3919,65023,49517,563 0 5 (1,837) 26,791 (1,035) 19,625 43,549 $162,648 Consolidated Statements Of Operations - USD (\$) shares in Millions, \$ in Millions Total net sales Operating expenses: Cost of sales Fulfillment Technology and content Marketing General and administrative Other operating expense (income), net Total operating expenses Operating income Interest income Interest expense Other income (expense), net Total non-operating income (expense) Income before income taxes Provision for income taxes Equity-method investment activity, net of tax Net income Basic earnings per share Diluted earnings per share Weighted-average shares used in computation of earnings per share: Basic (in shares) Diluted (in shares) Net product sales Total net sales Net service sales Total net sales 12 Months Ended Dec. 31, 2019 Dec. 31, 2018 Dec. 31, 2017 $280,522 $232,887 165,536 40,232 35,931 18,878 5,203 201 265,981 14,541 832 (1,600) 203 (565) 13,976 (2,374) (14) $11,588 $23.46 $23.01 494 504 $160,408 $120,114 139,156 34,027 28,837 13,814 4,336 296 220,466 12,421 440 (1,417) (183) (1,160) 11,261 (1,197) 9 $10,073 $20.68 $20.14 487 500 $141,915 $141,915 $90,972 $177,866 111,934 25,249 22,620 10,069 3,674 214 173,760 4,106 202 (848) 346 (300) 3,806 (769) (4) $3,033 $6.32 $6.15 480 493 $118,573 $59,293 I All descriptions are from Financial and Management Accounting: Information for Decisions John J. Wild \begin{tabular}{|l|} \hline Description: Measures a company's ability to use its assets efficiently and effectively. 1 \\ \hline Ratio Name: \\ \hline Formula: \\ \\ \hline Computation: \end{tabular} and Ken W. Shaw, 9th edition
 Step by Step Solution
There are 3 Steps involved in it
Step: 1

Get Instant Access to Expert-Tailored Solutions
See step-by-step solutions with expert insights and AI powered tools for academic success
Step: 2

Step: 3
Ace Your Homework with AI
Get the answers you need in no time with our AI-driven, step-by-step assistance
Get Started
Bank Performance, Risk And Firm Financing
Authors: P. Molyneux
1st Edition
0230313353, 9780230313354