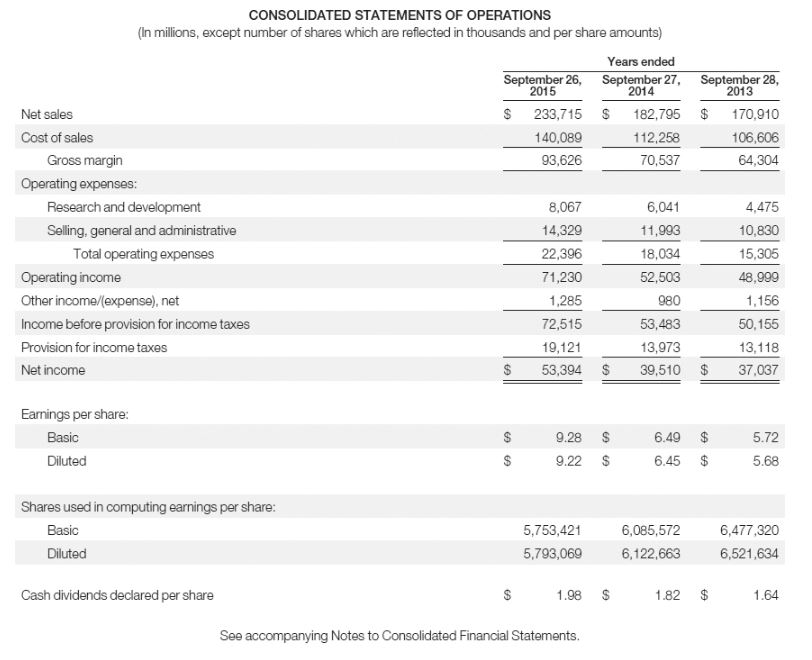
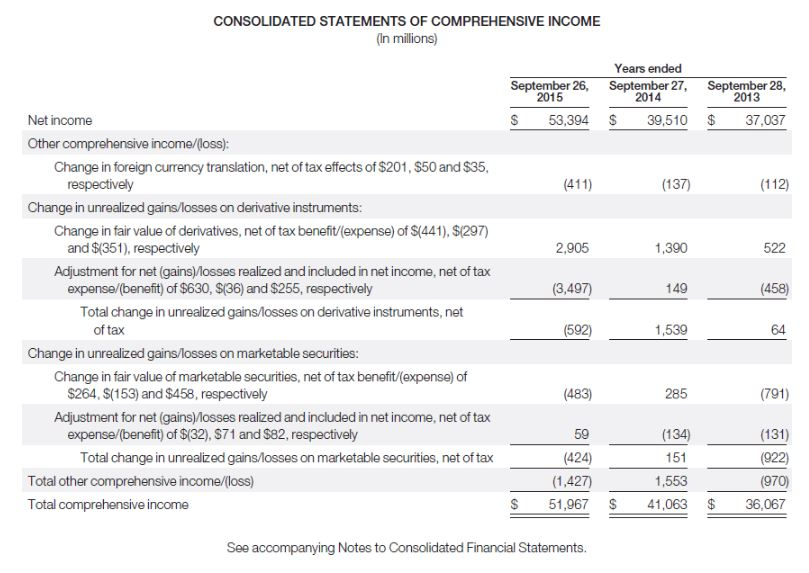
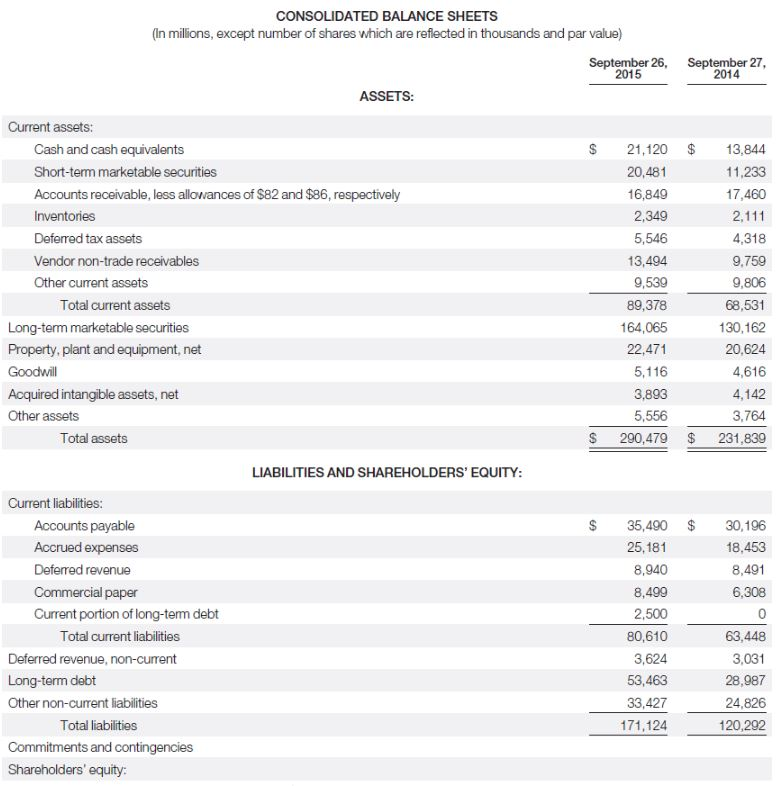
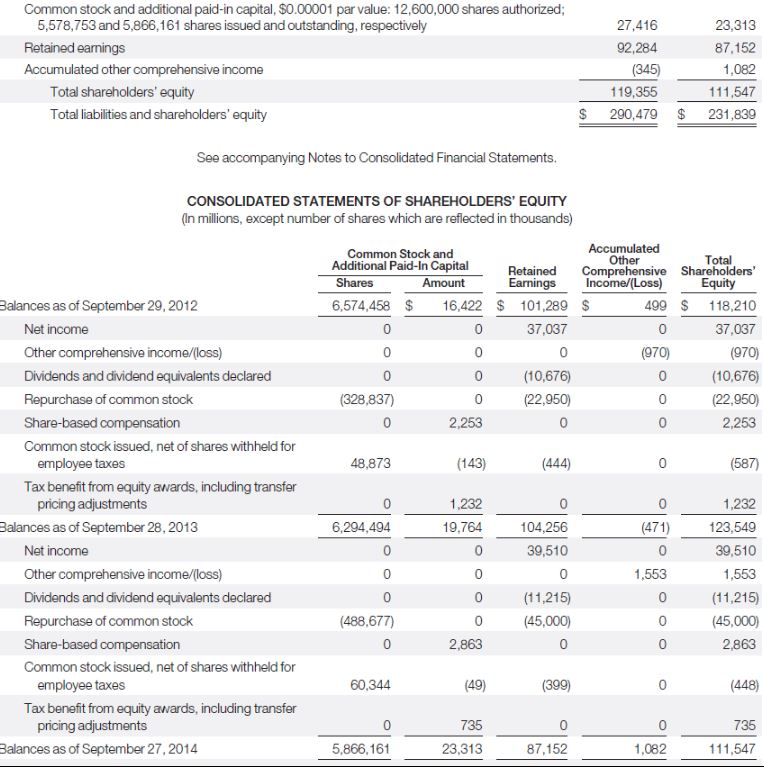
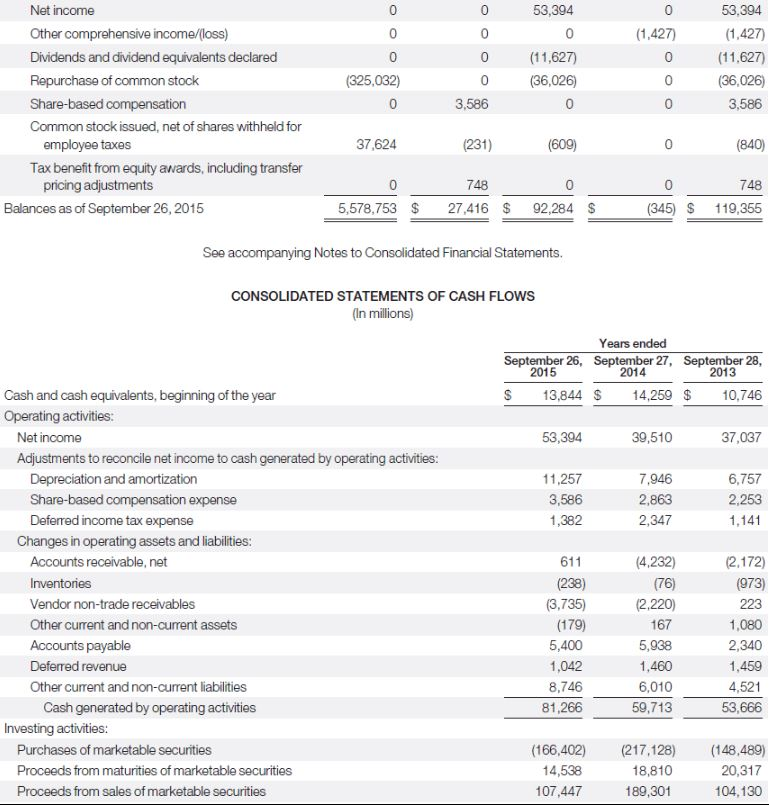
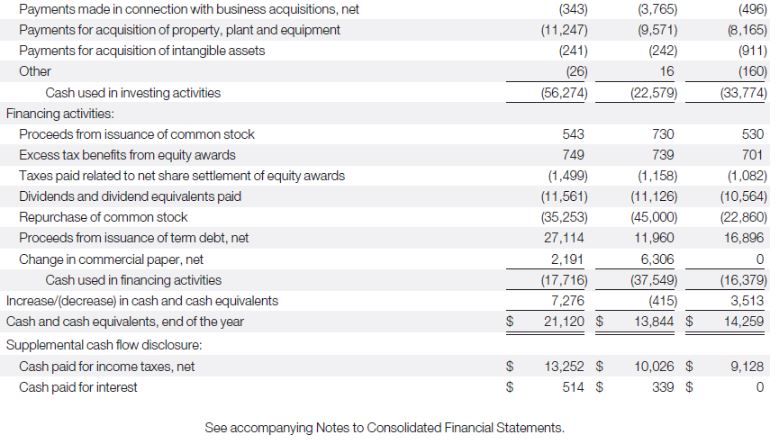
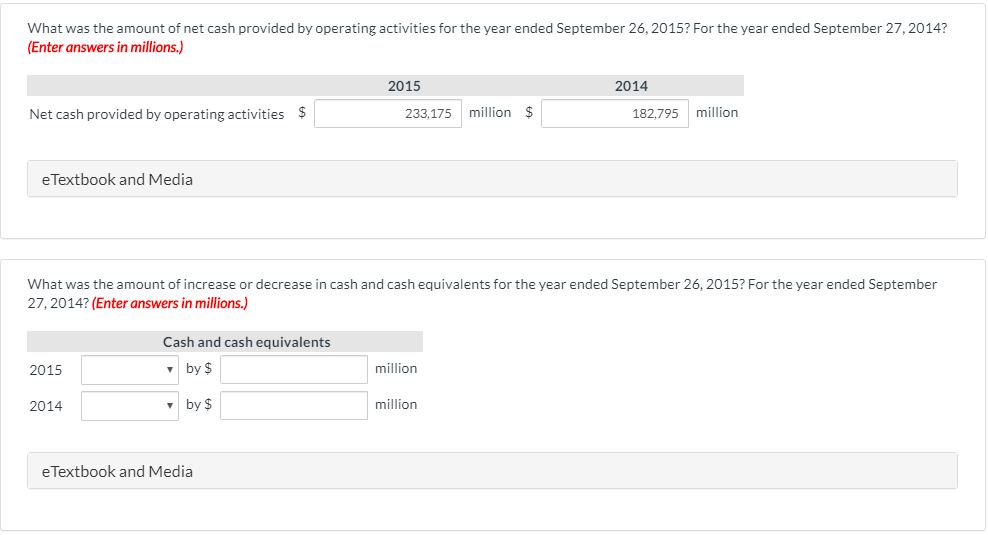
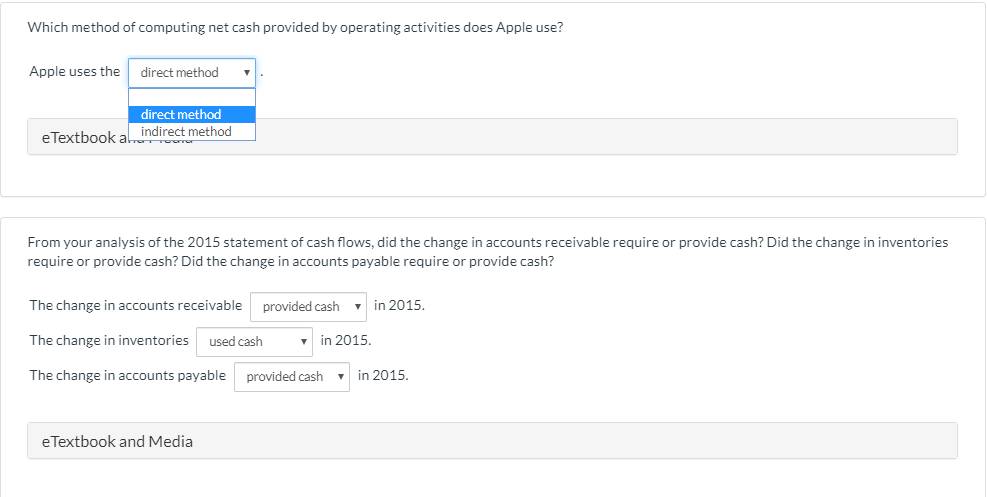
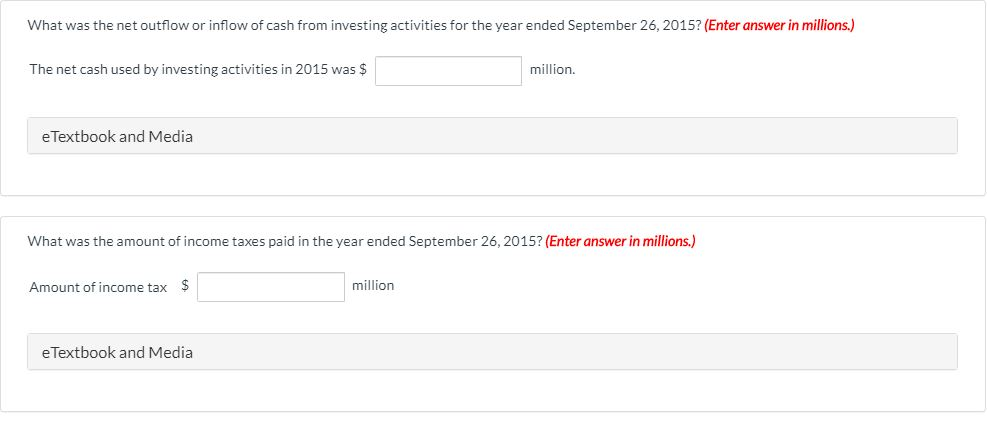
CONSOLIDATED STATEMENTS OF OPERATIONS (In millions, except number of shares which are reflected in thousands and per share amounts) September 26, 2015 $ 233,715 140,089 93,626 Years ended September 27, 2014 S 182,795 112,258 70.537 September 28, 2013 $ 170.910 106,606 64,304 8,067 Net sales Cost of sales Gross margin Operating expenses: Research and development Selling, general and administrative Total operating expenses Operating income Other income/expense), net Income before provision for income taxes Provision for income taxes Net income 6,041 11,993 18,034 52,503 4,475 10,830 15,305 48,999 14,329 22,396 71,230 1,285 72,515 19,121 53,394 980 1.156 53,483 13,973 39,510 50, 155 13,118 37,037 $ $ Earnings per share: Basic Diluted $ $ 9.28 9.22 $ $ 6.49 6.45 $ $ 5.72 5.68 Shares used in computing earnings per share: Basic Diluted 5,753,421 5,793,069 6,085,572 6,122,663 6,477,320 6,521,634 Cash dividends declared per share $ 1,98 $ 1.82 $ 1.64 See accompanying Notes to Consolidated Financial Statements. CONSOLIDATED STATEMENTS OF COMPREHENSIVE INCOME (In millions) September 26, 2015 $ 53,394 Years ended September 27, 2014 $ 39,510 September 28, $ 37,037 (411) (137) (112) 2,905 1,390 (3,497) 149 Net income Other comprehensive income/loss): Change in foreign currency translation, net of tax effects of $201, S50 and $35, respectively Change in unrealized gains/losses on derivative instruments: Change in fair value of derivatives, net of tax benefit/(expense) of $(441), $(297) and $(351), respectively Adjustment for net (gains)/losses realized and included in net income, net of tax expense/(benefit) of $630, $(36) and $255, respectively Total change in unrealized gains/losses on derivative instruments, net of tax Change in unrealized gains/losses on marketable securities: Change in fair value of marketable securities, net of tax benefit/(expense) of $264. $(153) and $458, respectively Adjustment for net (gains) losses realized and included in net income, net of tax expense/(benefit) of $(32), $71 and $82, respectively Total change in unrealized gains/losses on marketable securities, net of tax Total other comprehensive income/loss) Total comprehensive income (592) 1,539 (483) 285 59 (424) (134) 151 1,553 41,063 (131) (922) (970) 36,067 (1,427) $ 51,967 $ $ See accompanying Notes to Consolidated Financial Statements. CONSOLIDATED BALANCE SHEETS (In millions, except number of shares which are reflected in thousands and par value) September 26, 2015 September 27, 2014 ASSETS: $ Current assets: Cash and cash equivalents Short-term marketable securities Accounts receivable, less allowances of $82 and $86, respectively Inventories Deferred tax assets Vendor non-trade receivables Other current assets Total current assets Long-term marketable securities Property, plant and equipment, net Goodwill Acquired intangible assets, net Other assets Total assets 21,120 20,481 16,849 2,349 5,546 13,494 9,539 89,378 164,065 22,471 5,116 3,893 5,556 290,479 13,844 11,233 17,460 2,111 4,318 9.759 9,806 68,531 130,162 20,624 4,616 4.142 3.764 231.839 $ $ LIABILITIES AND SHAREHOLDERS' EQUITY: $ 35,490 25,181 30,196 18,453 8,491 6,308 8,940 Current liabilities: Accounts payable Accrued expenses Deferred revenue Commercial paper Current portion of long-term debt Total current liabilities Deferred revenue, non-current Long-term debt Other non-current liabilities Total liabilities Commitments and contingencies Shareholders' equity: 8,499 2,500 80,610 3,624 53,463 33,427 171,124 63,448 3,031 28,987 24.826 120,292 Common stock and additional paid-in capital, $0.00001 par value: 12,600,000 shares authorized; 5,578,753 and 5,866,161 shares issued and outstanding, respectively Retained earnings Accumulated other comprehensive income Total shareholders' equity Total liabilities and shareholders' equity 27,416 92,284 (345) 119,355 290,479 23,313 87.152 1,082 111,547 231,839 $ $ See accompanying Notes to Consolidated Financial Statements. CONSOLIDATED STATEMENTS OF SHAREHOLDERS' EQUITY (In millions, except number of shares which are reflected in thousands) Common Stock and Additional Paid-In Capital Amount 6,574,458 $ 16,422 0 0 Accumulated Other Total Retained Comprehensive Shareholders' Earnings Income/(Loss) Equity $ 101,289 $ 499 $ 118,210 37,037 37,037 0 (970) (970) (10,676) (10,676) (22,950) (22,950) 0 2,253 1070 0 (328,837) 2,253 48,873 (143) (444) (587) Balances as of September 29, 2012 Net income Other comprehensive income/loss) Dividends and dividend equivalents declared Repurchase of common stock Share-based compensation Common stock issued, net of shares withheld for employee taxes Tax benefit from equity awards, including transfer pricing adjustments Balances as of September 28, 2013 Net income Other comprehensive income/loss) Dividends and dividend equivalents declared Repurchase of common stock Share-based compensation Common stock issued, net of shares withheld for employee taxes Tax benefit from equity awards, including transfer pricing adjustments Balances as of September 27, 2014 1.232 19,764 6,294,494 104,256 39,510 0 O 1,553 1,232 123,549 39,510 1,553 (11,215) (45,000) 2,863 (488,677) (11,215) (45,000) 0 0 2,863 looooo 60,344 (49) (399) (448) 735 23,313 0 87,152 735 111,547 5,866,161 1,082 0 (1,427) Net income Other comprehensive income/(loss) Dividends and dividend equivalents declared Repurchase of common stock Share-based compensation Common stock issued, net of shares withheld for employee taxes Tax benefit from equity awards, including transfer pricing adjustments Balances as of September 26, 2015 53,394 0 (11,627) (36,026) 0 53,394 (1,427) (11,627) (36,026) 3,586 (325,032) 0 3,586 0 0 37,624 (231) (609) 0 (840) 0 5,578,753 748 27,416 0 92,284 0 (345) $ 748 119,355 $ $ S See accompanying Notes to Consolidated Financial Statements. CONSOLIDATED STATEMENTS OF CASH FLOWS (In millions) Years ended September 26, September 27, September 28, 2015 2014 2013 $ 13,844 $ 14,250 $ 10,746 53,394 39,510 37,037 6,757 11,257 3,586 1,382 7,946 2,863 2,347 2,253 1,141 Cash and cash equivalents, beginning of the year Operating activities: Net income Adjustments to reconcile net income to cash generated by operating activities: Depreciation and amortization Share-based compensation expense Deferred income tax expense Changes in operating assets and liabilities: Accounts receivable, net Inventories Vendor non-trade receivables Other current and non-current assets Accounts payable Deferred revenue Other current and non-current liabilities Cash generated by operating activities Investing activities: Purchases of marketable securities Proceeds from maturities of marketable securities Proceeds from sales of marketable securities 611 (238) (3,735) (179) 5,400 1,042 8,746 81,266 (4,232) (76) (2,220) 167 5,938 1,460 6,010 59,713 (2,172) (973) 223 1,080 2,340 1,459 4,521 53,666 (166,402) 14,538 107,447 (217.128) 18,810 189,301 (148,489) 20,317 1 04,130 (496) (343) (11,247) (241) (26) (56,274) (3,765) (9,571) (242) 16 (22,579) (8.165) (911) (160) (33,774) 730 739 Payments made in connection with business acquisitions, net Payments for acquisition of property, plant and equipment Payments for acquisition of intangible assets Other Cash used in investing activities Financing activities: Proceeds from issuance of common stock Excess tax benefits from equity awards Taxes paid related to net share settlement of equity awards Dividends and dividend equivalents paid Repurchase of common stock Proceeds from issuance of ter debt, net Change in commercial paper, net Cash used in financing activities Increase/(decrease) in cash and cash equivalents Cash and cash equivalents, end of the year Supplemental cash flow disclosure: Cash paid for income taxes, net Cash paid for interest 543 749 (1,499) (11,561) (35,253) 27,114 530 701 (1,082) (10,564) (22,860) 16,896 (1,158) (11,126) (45,000) 11,960 6,306 (37,549) (415) 13,844 $ (17.716) 7,276 21,120 $ (16,379) 3,513 14,259 $ $ 13,252 $ 514 $ 10,026 $ 339 $ 9,128 0 See accompanying Notes to Consolidated Financial Statements. What was the amount of net cash provided by operating activities for the year ended September 26, 2015? For the year ended September 27, 2014? (Enter answers in millions.) 2015 233,175 million $ 2014 182,795 Net cash provided by operating activities $ million e Textbook and Media What was the amount of increase or decrease in cash and cash equivalents for the year ended September 26, 2015? For the year ended September 27, 2014? (Enter answers in millions.) Cash and cash equivalents 2015 by $ million 2014 by $ million e Textbook and Media Which method of computing net cash provided by operating activities does Apple use? Apple uses the direct method . direct method e Textbook a indirect method From your analysis of the 2015 statement of cash flows, did the change in accounts receivable require or provide cash? Did the change in inventories require or provide cash? Did the change in accounts payable require or provide cash? The change in accounts receivable provided cash in 2015. The change in inventories used cash in 2015. The change in accounts payable provided cash in 2015. e Textbook and Media What was the net outflow or inflow of cash from investing activities for the year ended September 26, 2015? (Enter answer in millions.) The net cash used by investing activities in 2015 was $ million. e Textbook and Media What was the amount of income taxes paid in the year ended September 26, 2015? (Enter answer in millions.) Amount of income tax $ million e Textbook and Media