

Question: Construct a broken-line graph of the data in the table. Please upload your graph when finished The following table gives the total amount of precipitation
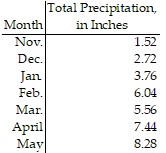
Construct a broken-line graph of the data in the table. Please upload your graph when finished The following table gives the total amount of precipitation during the given months. Use time on the horizontal scale for your line graph.

Step by Step Solution
There are 3 Steps involved in it
1 Expert Approved Answer
Step: 1 Unlock

Question Has Been Solved by an Expert!
Get step-by-step solutions from verified subject matter experts
Step: 2 Unlock
Step: 3 Unlock