Answered step by step
Verified Expert Solution
Question
1 Approved Answer
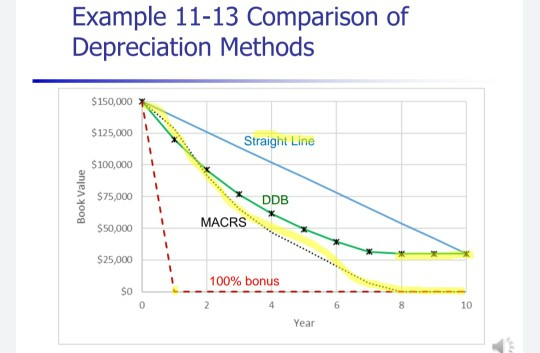
Construct a chart it must show all the depreciation methods in the same chart. Interpret the results. Tables: Straight-line depreciation Double declining balance depreciation 100%
Construct a chart it must show all the depreciation methods in the same chart. Interpret the results.
Tables: Straight-line depreciation

Double declining balance depreciation

100% bonus depreciation

Macrs depreciation

Please help me. It's very important to my class. Thanks a lot!

Similar to this graph Thanks a lot!
Year C=12000-B Annual Depreciation Accumulated Depreciation End of Year Book Value $2,400 $2,400 $9,600 $2,400 $4,800 $7,200 $2,400 $7,200 $4,800 $2,400 $9,600 $2,400 $2,400 $12,000 $0 w B=A*40% Beginning Book Value Annual Depreciation $12,000 $4,800 $7,200 $2,800 43201 $1,728 2592 $1,037 1555 $622 D=12000-C Accumulated Depreciation End of Year Book Value $4,800 $7,200 $7,680 $4,320 $9,408 $2,592 $10,445 $1,555 $11,067 $933 Year C=12000-B Annual Depreciation Accumulated Depreciation End of Year Book Value 12000 12000 120001 12000 12000 12000 Year B=12000*A MACRS Depreciation Rate (TableA-1) Annual Depreciation 0.2 $2,400 0.32 $3,840 0.192 $2,304 0.1152 $1,382 0.1152 $1,382 0.0576 $691 C=12000-B Accumulated Depreciation End of Year Book Value $2,400 $9,600 $6,240 $5,760 $8,544 $3,456 $9,926 $2,074 $11,309 $691 $12,000 ol Example 11-13 Comparison of Depreciation Methods $150,000 $125,000 Straight Line $100,000 Book Value $75,000 DDB MACRS $50,000 $25,000 100% bonusStep by Step Solution
There are 3 Steps involved in it
Step: 1

Get Instant Access to Expert-Tailored Solutions
See step-by-step solutions with expert insights and AI powered tools for academic success
Step: 2

Step: 3

Ace Your Homework with AI
Get the answers you need in no time with our AI-driven, step-by-step assistance
Get Started


