Question
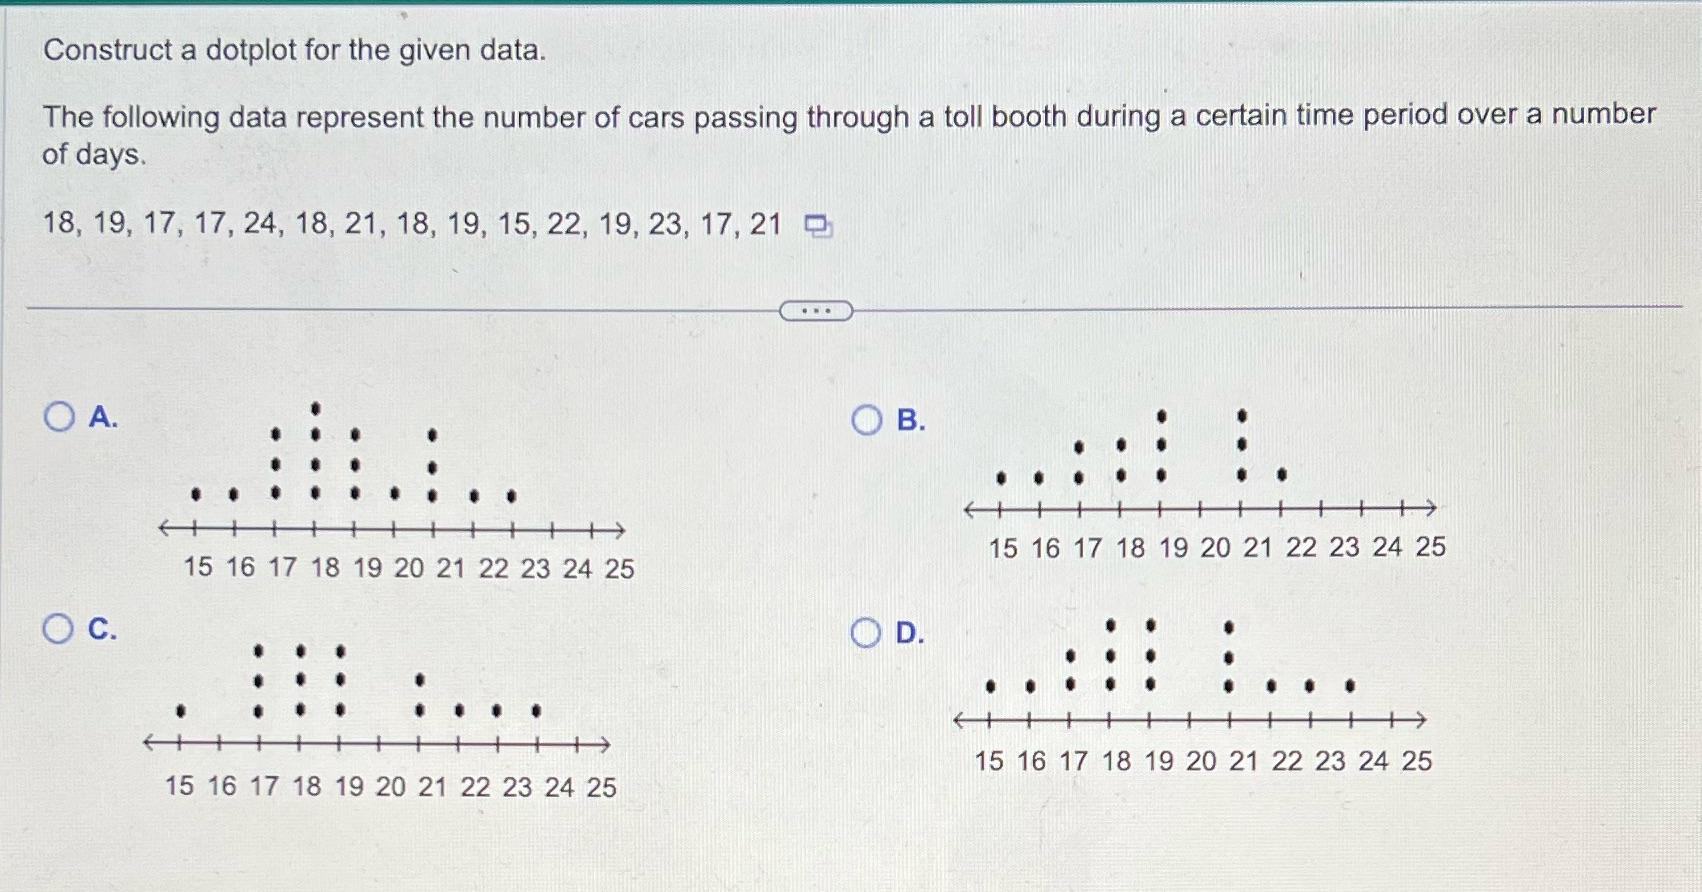
Construct a dotplot for the given data. The following data represent the number of cars passing through a toll booth during a certain time

Construct a dotplot for the given data. The following data represent the number of cars passing through a toll booth during a certain time period over a number of days. 18, 19, 17, 17, 24, 18, 21, 18, 19, 15, 22, 19, 23, 17, 21 O A. C. :.. + 15 16 17 18 19 20 21 22 23 24 25 * ++> 15 16 17 18 19 20 21 22 23 24 25 O B. OD. H 15 16 17 18 19 20 21 22 23 24 25 .. . .... H 15 16 17 18 19 20 21 22 23 24 25
Step by Step Solution
There are 3 Steps involved in it
Step: 1

Get Instant Access to Expert-Tailored Solutions
See step-by-step solutions with expert insights and AI powered tools for academic success
Step: 2

Step: 3

Ace Your Homework with AI
Get the answers you need in no time with our AI-driven, step-by-step assistance
Get StartedRecommended Textbook for
Applied Statistics For Public And Nonprofit Administration
Authors: Kenneth J. Meier, Jeffrey L. Brudney, John Bohte
9th Edition
1285737237, 978-1285974521, 1285974522, 978-1285737232
Students also viewed these Databases questions
Question
Answered: 1 week ago
Question
Answered: 1 week ago
Question
Answered: 1 week ago
Question
Answered: 1 week ago
Question
Answered: 1 week ago
Question
Answered: 1 week ago
Question
Answered: 1 week ago
Question
Answered: 1 week ago
Question
Answered: 1 week ago
Question
Answered: 1 week ago
Question
Answered: 1 week ago
Question
Answered: 1 week ago
Question
Answered: 1 week ago
Question
Answered: 1 week ago
Question
Answered: 1 week ago
Question
Answered: 1 week ago
Question
Answered: 1 week ago
Question
Answered: 1 week ago
Question
Answered: 1 week ago
Question
Answered: 1 week ago
Question
Answered: 1 week ago
View Answer in SolutionInn App


