Question
Construct a scatter diagram for the given data. Determine whether there is a positive linear correlation, negative linear correlation, or no linear correlation. Lastly

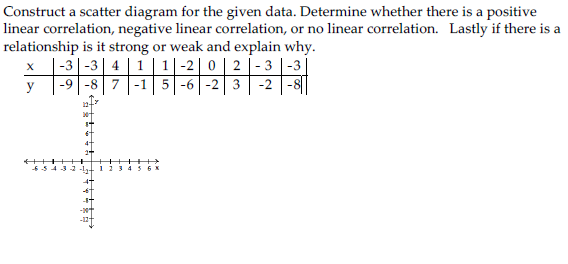
Construct a scatter diagram for the given data. Determine whether there is a positive linear correlation, negative linear correlation, or no linear correlation. Lastly if there is a relationship is it strong or weak and explain why. X -3-3| 4 | 1 | 1|-2| 0 | 2 |-3-3| -9 -8 7 -1 5-6 -2 3 -2 y H 6 5 4 3 2 1 1 2 3 4 5 6 4+ -61 -x+
Step by Step Solution
3.43 Rating (159 Votes )
There are 3 Steps involved in it
Step: 1

Get Instant Access to Expert-Tailored Solutions
See step-by-step solutions with expert insights and AI powered tools for academic success
Step: 2

Step: 3

Ace Your Homework with AI
Get the answers you need in no time with our AI-driven, step-by-step assistance
Get StartedRecommended Textbook for
Elementary Statistics Picturing The World
Authors: Ron Larson, Betsy Farber
7th Edition
134683412, 978-0134683416
Students also viewed these Mathematics questions
Question
Answered: 1 week ago
Question
Answered: 1 week ago
Question
Answered: 1 week ago
Question
Answered: 1 week ago
Question
Answered: 1 week ago
Question
Answered: 1 week ago
Question
Answered: 1 week ago
Question
Answered: 1 week ago
Question
Answered: 1 week ago
Question
Answered: 1 week ago
Question
Answered: 1 week ago
Question
Answered: 1 week ago
Question
Answered: 1 week ago
Question
Answered: 1 week ago
Question
Answered: 1 week ago
Question
Answered: 1 week ago
Question
Answered: 1 week ago
Question
Answered: 1 week ago
Question
Answered: 1 week ago
Question
Answered: 1 week ago
Question
Answered: 1 week ago
Question
Answered: 1 week ago
View Answer in SolutionInn App


