Question
Construct a scatter plot for two variables, compute a correlation coefficient, and a regression equation. use the regression equation to predict a value of the
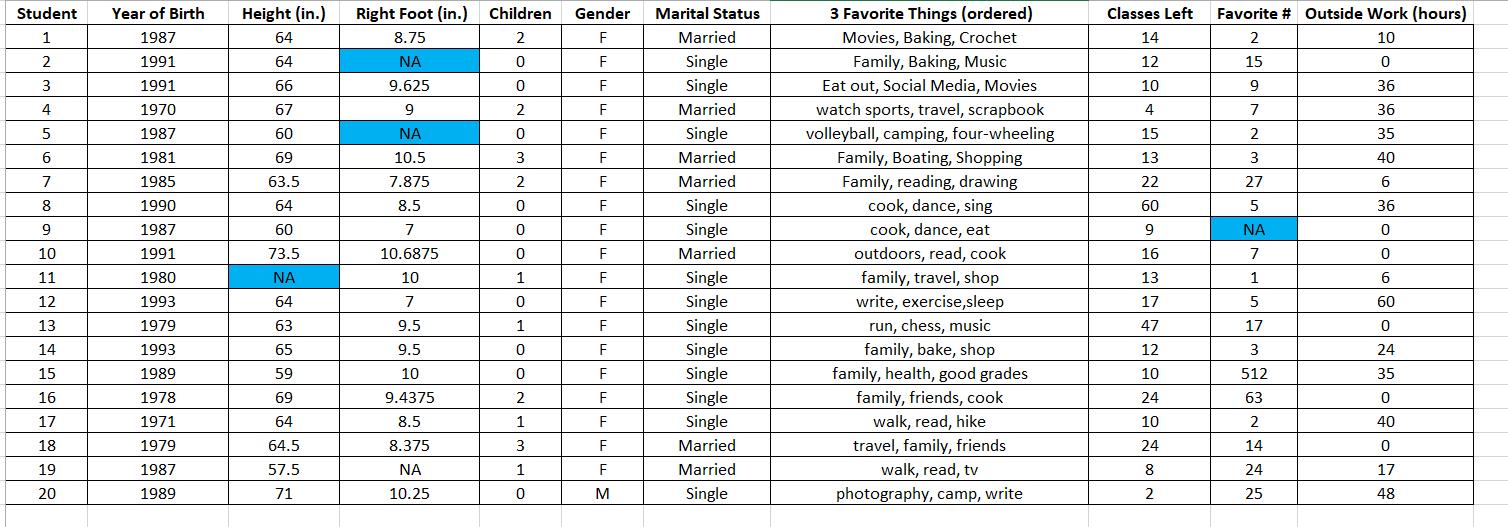
Construct a scatter plot for two variables, compute a correlation coefficient, and a regression equation. use the regression equation to predict a value of the dependent variable. purpose: in this week's task, we will use our height/length of foot data from week 2 to calculate and interpret the correlation coefficient. we also find a regression equation and use it to predict length of foot based on height. task description: this week we will use the data collected in week one for height and length of foot. we will determine whether there is a significant relationship between the two variables. 1. create a scatter plot for height and length of foot. we will assume here that height influences length of foot so height will be the independent variable. does it appear from the plot that there is a relationship between the two variables? what type of relationship would that be? 2. using excel, calculate the correlation coefficient, r, for the two variables. how would you interpret this measure? 3. what would be the hypotheses to test this relationship? is the relationship significant? you can use table i in your book to determine significance. 4. using excel, find the regression equation to predict length of foot using height. write it in slope-intercept format. 5. use the regression equation to predict a foot length for a height of 62 inches. parameters

Student 1 2 3 4 5 6 7 8 9 10 11 12 13 14 15 16 17 18 19 20 Year of Birth 1987 1991 1991 1970 1987 1981 1985 1990 1987 1991 1980 1993 1979 1993 1989 1978 1971 1979 1987 1989 Height (in.) 64 64 66 67 60 69 63.5 64 60 73.5 64 63 65 59 69 64 64.5 57.5 71 Right Foot (in.) 8.75 9.625 9 10.5 7.875 8.5 7 10.6875 10 7 9.5 9.5 10 9.4375 8.5 8.375 10.25 Children 2 0 0 2 0 3 2 0 0 0 1 0 1 0 0 2 1 3 1 0 Gender F F F F F F F F F F F F F F F F F F F M Marital Status Married Single Single Married Single Married Married Single Single Married Single Single Single Single Single Single Single Married Married Single 3 Favorite Things (ordered) Movies, Baking, Crochet Family, Baking, Music Eat out, Social Media, Movies watch sports, travel, scrapbook volleyball, camping, four-wheeling Family, Boating, Shopping Family, reading, drawing cook, dance, sing cook, dance, eat outdoors, read, cook family, travel, shop write, exercise,sleep run, chess, music family, bake, shop family, health, good grades family, friends, cook walk, read, hike travel, family, friends walk, read, tv photography, camp, write Classes Left Favorite # Outside Work (hours) 2 10 15 0 9 36 7 36 2 35 3 40 27 6 5 7 1 5 17 3 512 63 2 14 24 25 14 12 10 4 15 13 22 60 9 16 13 17 47 12 10 24 10 24 8 2 36 0 0 6 60 0 24 35 0 40 0 17 48
Step by Step Solution
3.57 Rating (168 Votes )
There are 3 Steps involved in it
Step: 1
Thank you for providing the data To create a scatter plot for height and length of foot calculate the correlation coefficient and find the regression equation using Excel you can follow these steps 1 ...
Get Instant Access to Expert-Tailored Solutions
See step-by-step solutions with expert insights and AI powered tools for academic success
Step: 2

Step: 3

Ace Your Homework with AI
Get the answers you need in no time with our AI-driven, step-by-step assistance
Get Started


