

Answered step by step
Verified Expert Solution
Question
1 Approved Answer
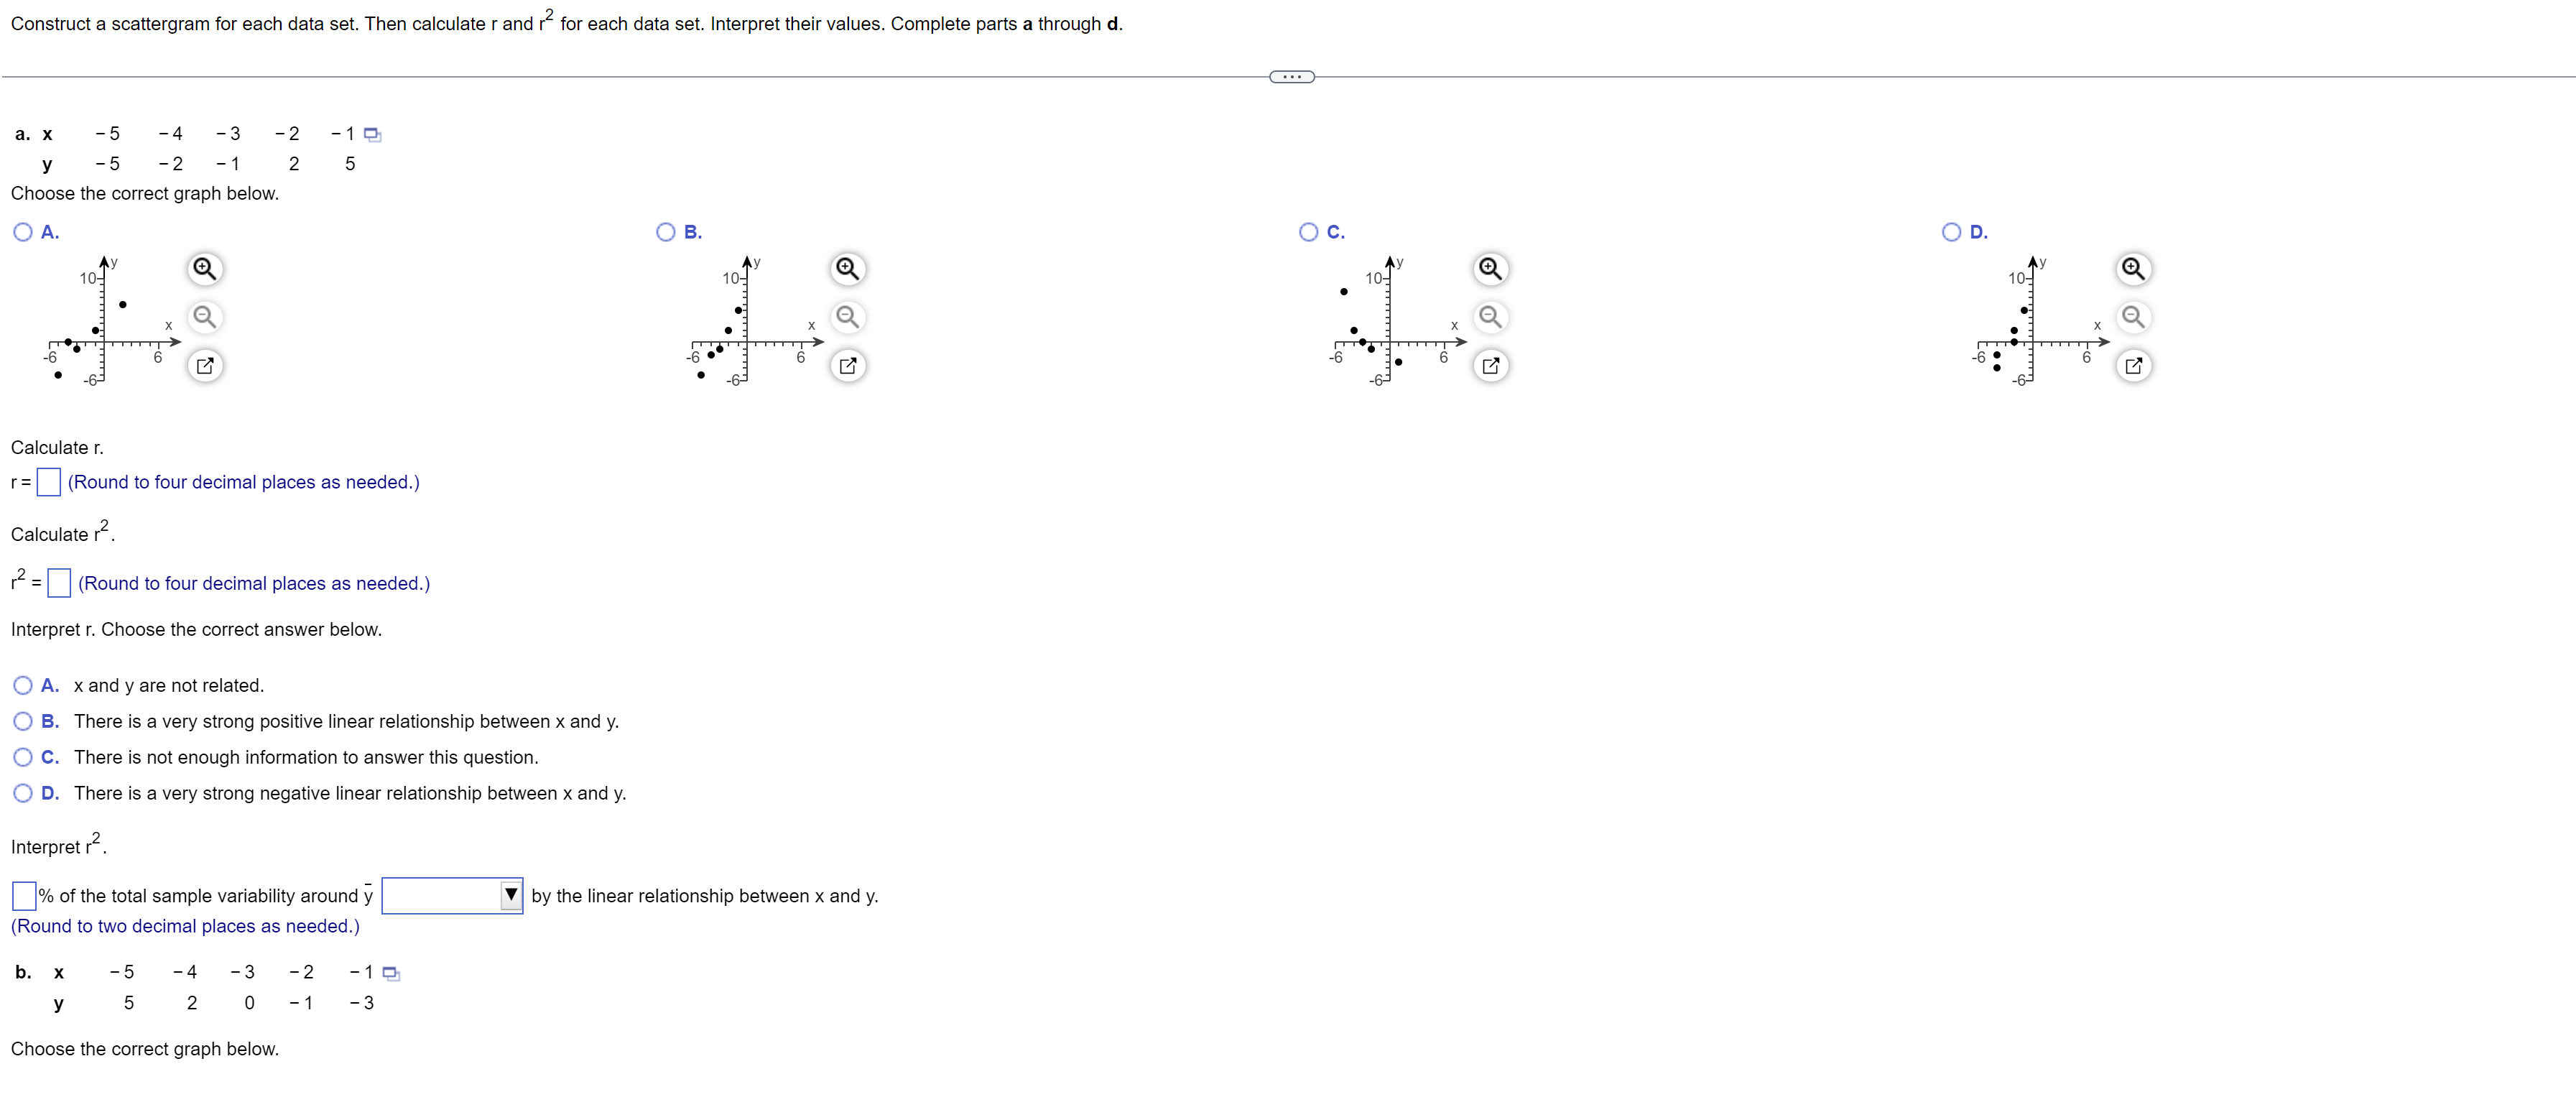
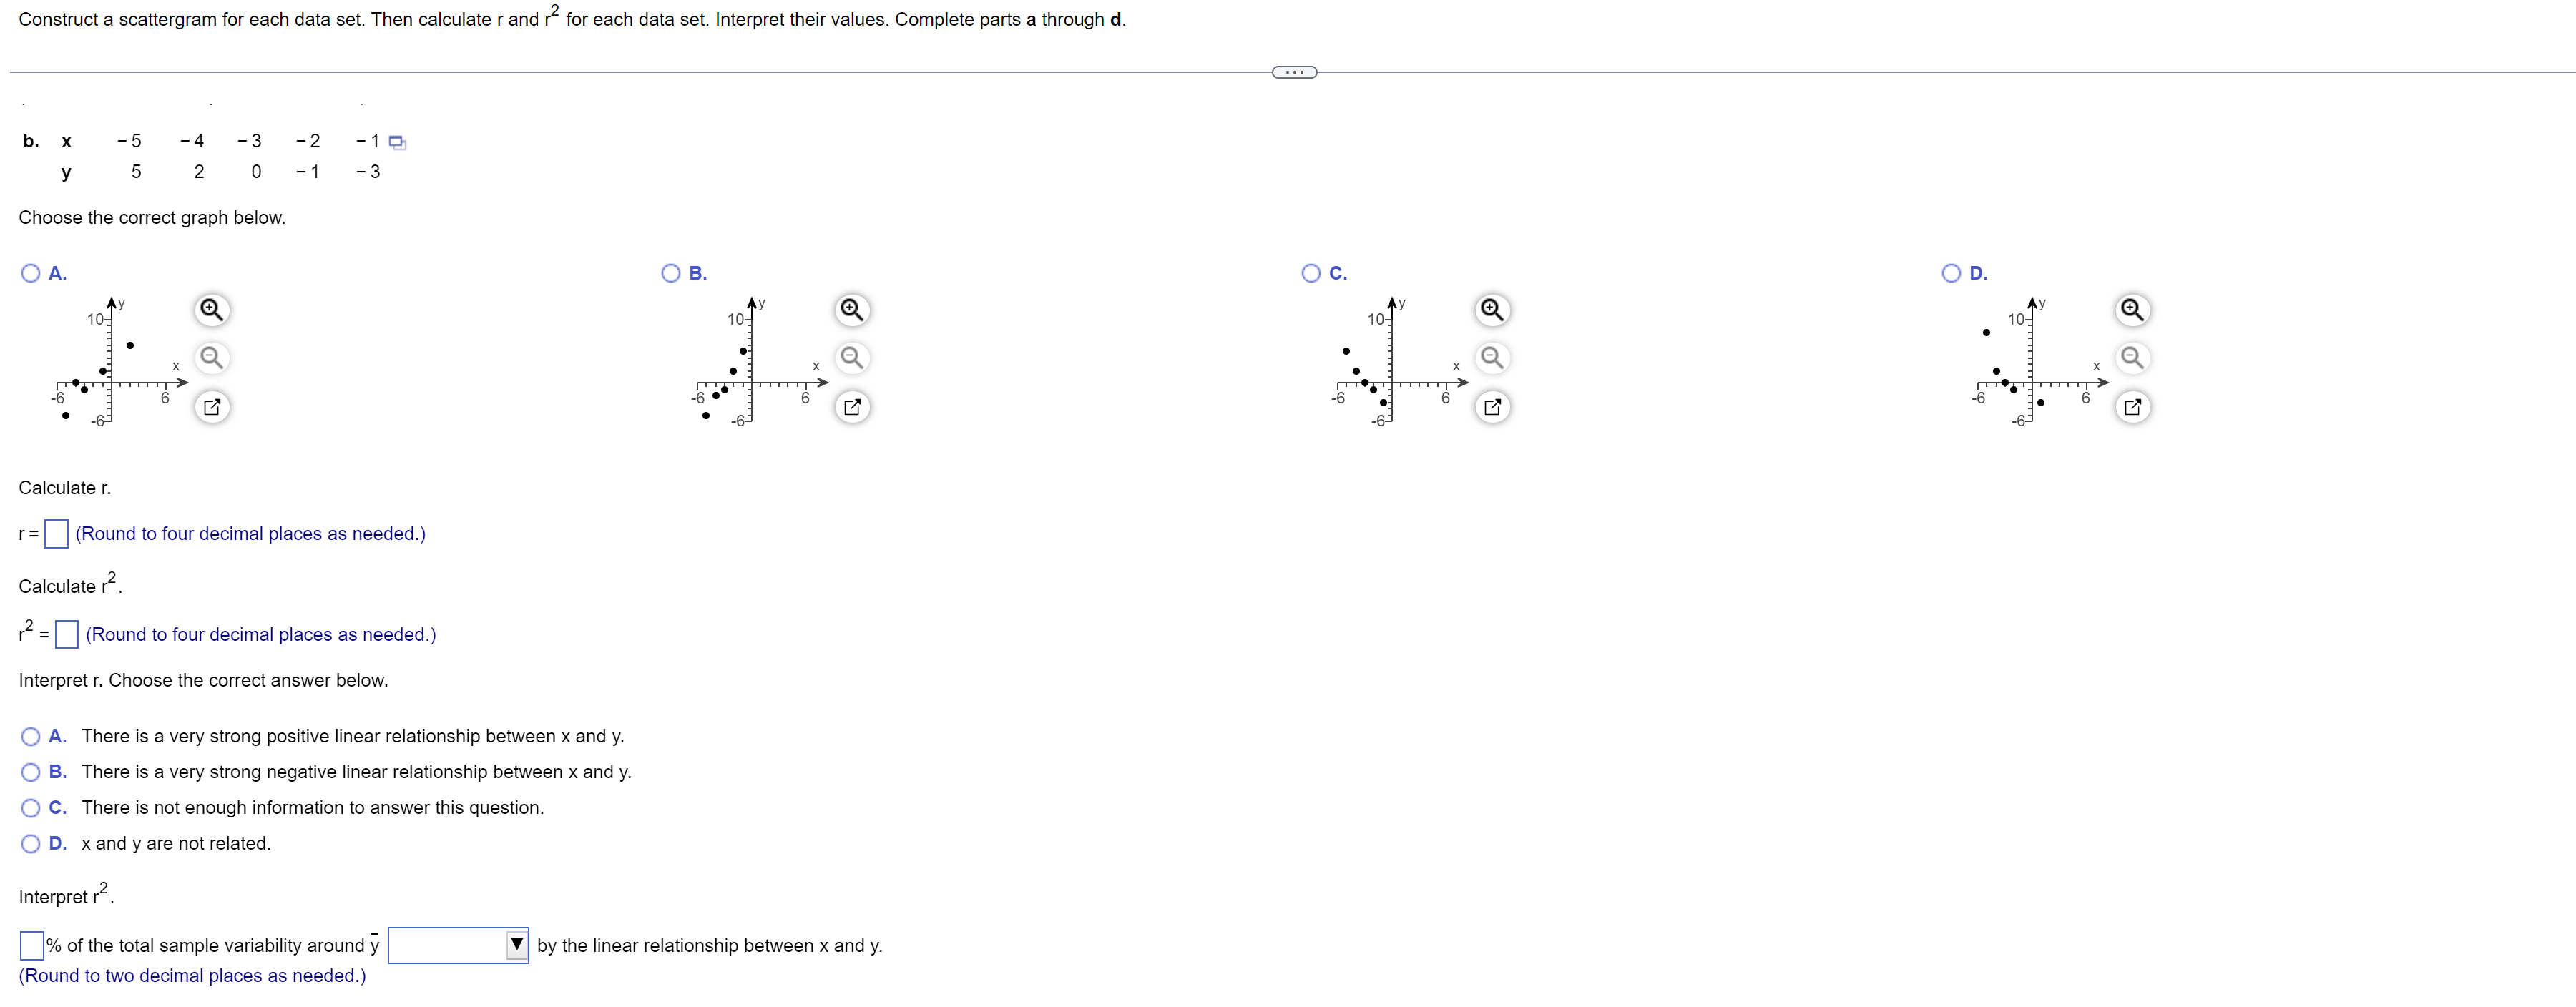
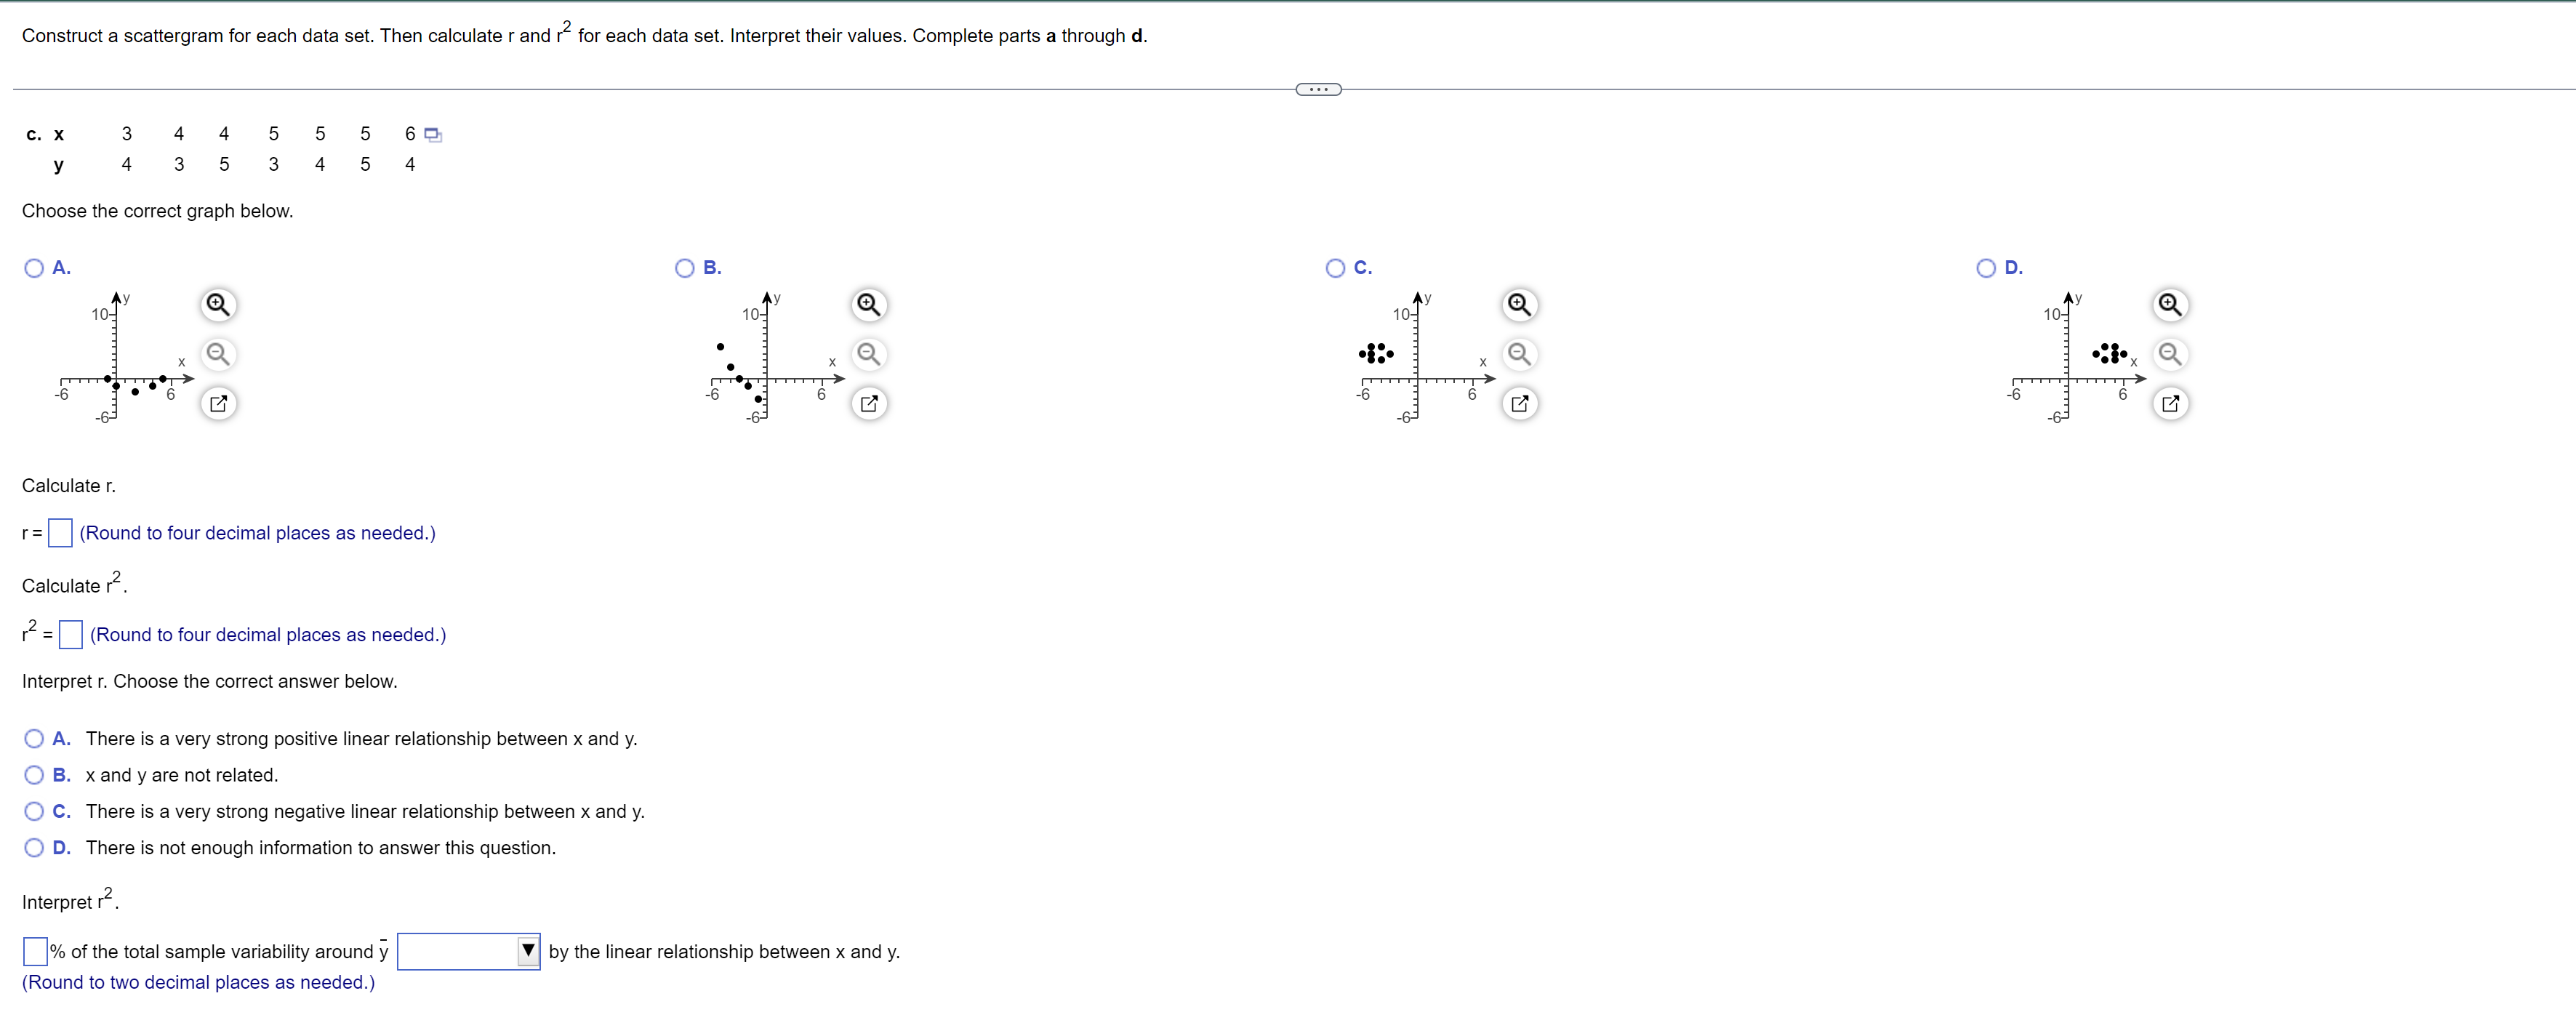
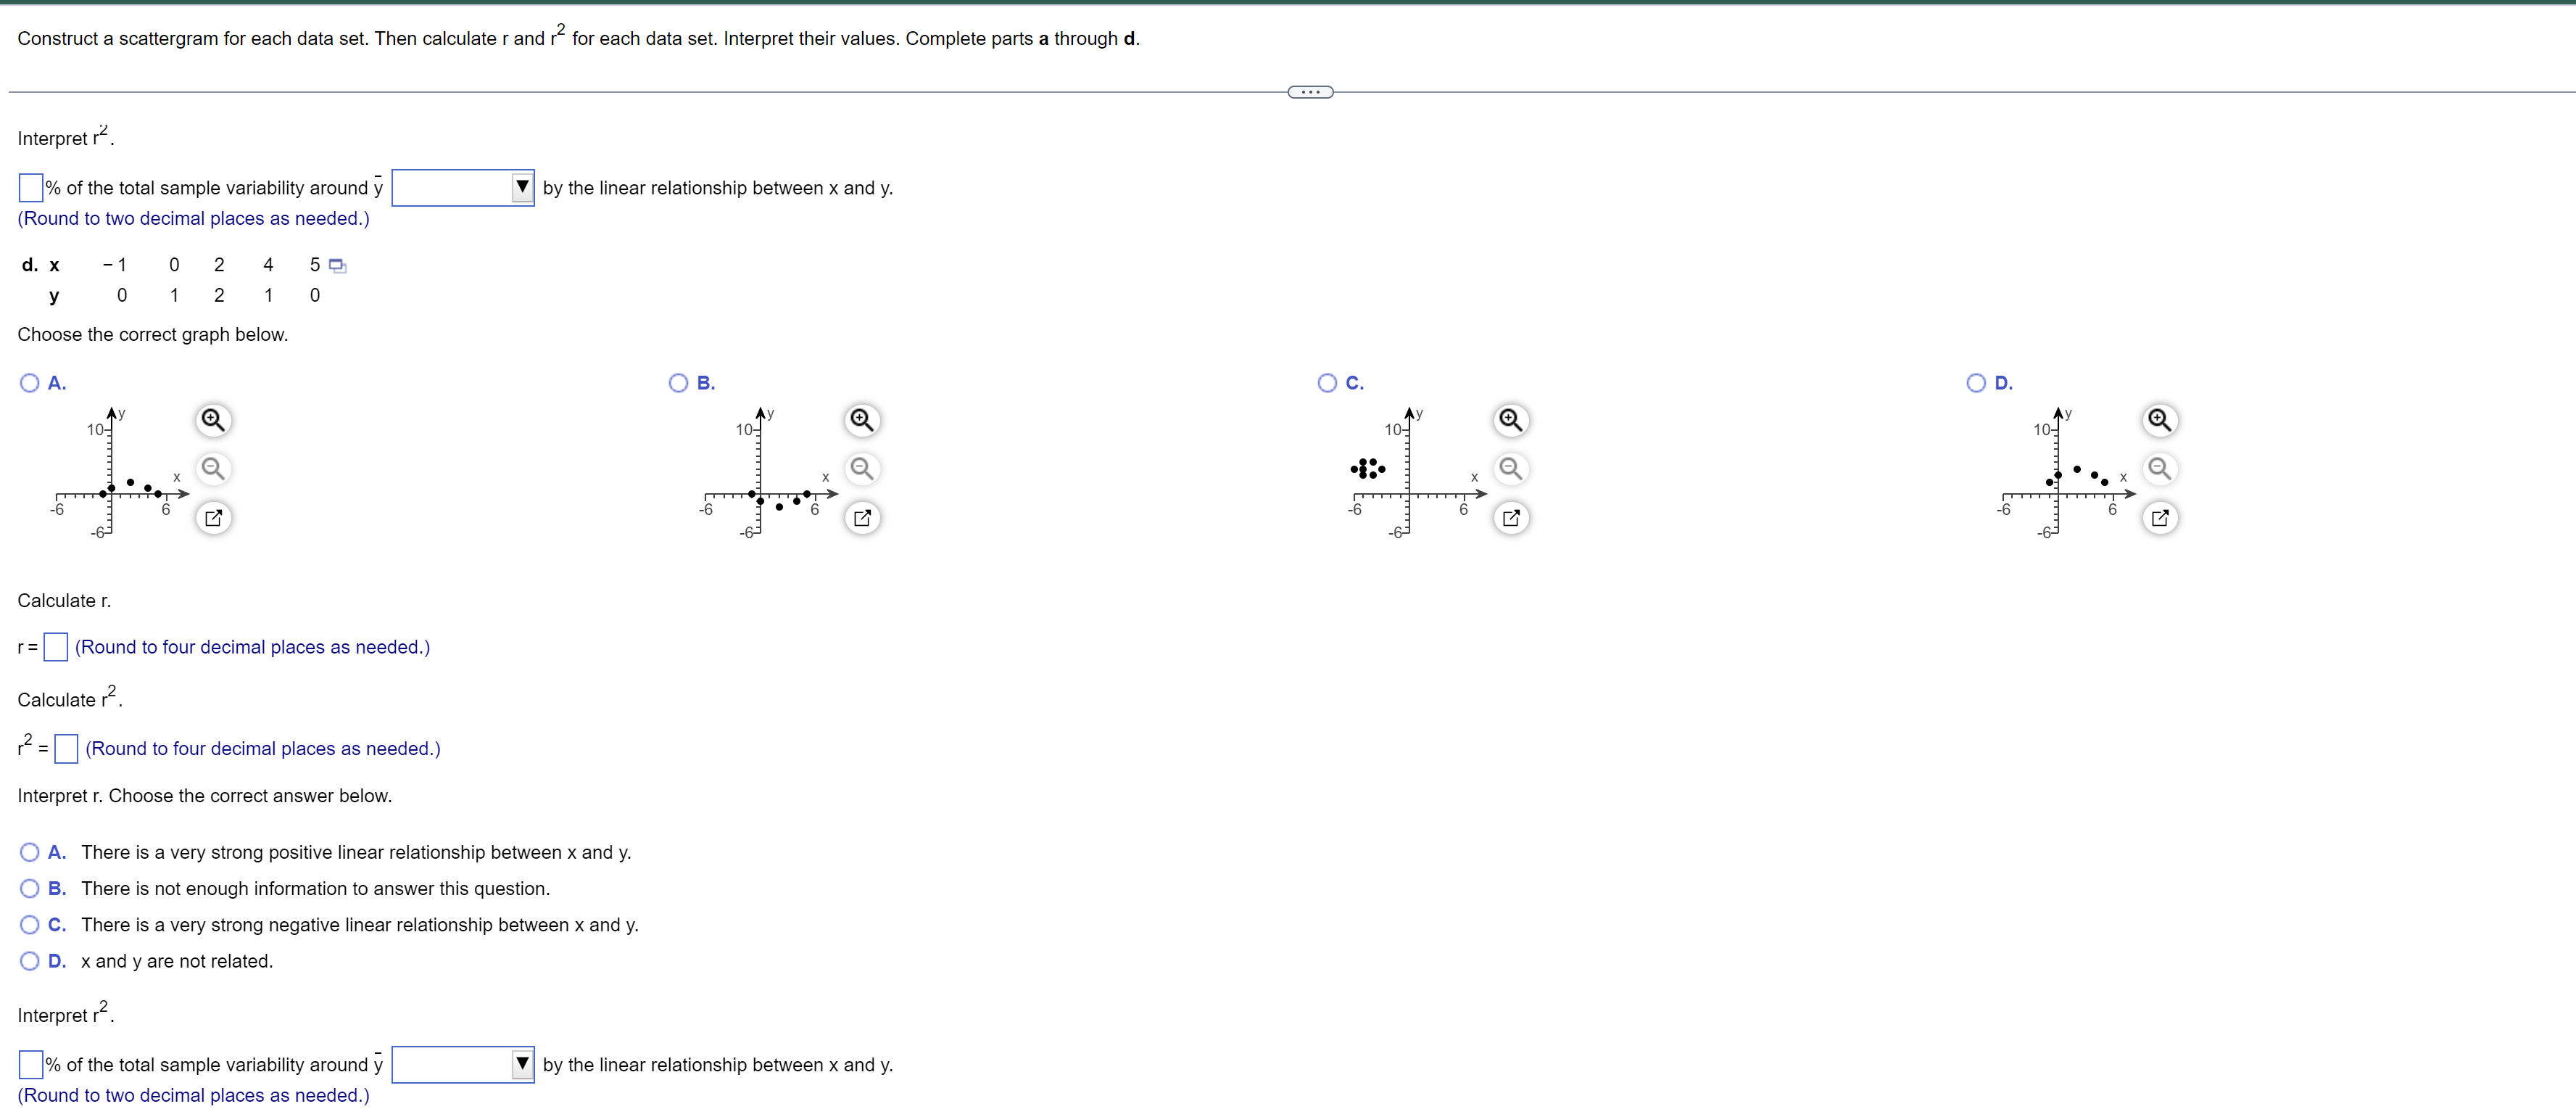
Construct a scattergram tor each data set. Then calculate r and r2 tor each data set. interpret their values. Complete parts a through d. a.
Step by Step Solution
There are 3 Steps involved in it
Step: 1

Get Instant Access to Expert-Tailored Solutions
See step-by-step solutions with expert insights and AI powered tools for academic success
Step: 2

Step: 3
Ace Your Homework with AI
Get the answers you need in no time with our AI-driven, step-by-step assistance
Get Started
College Algebra (Subscription)
Authors: Mark Dugopolski
6th Edition
0321916670, 9780321916679