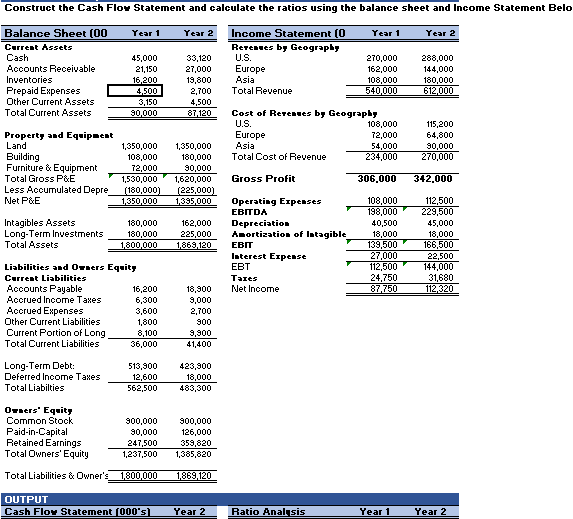
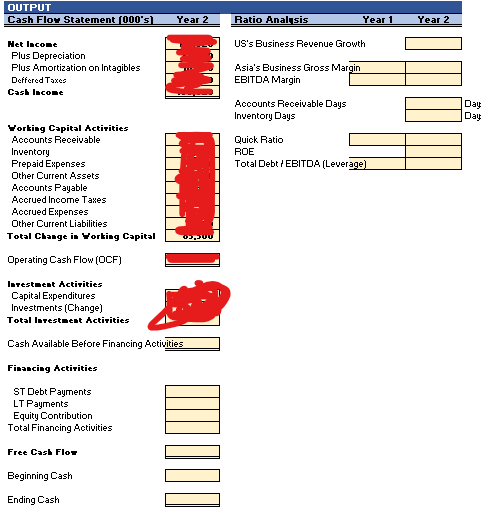
Construct the Cash Flow Statement and calculate the ratios using the balance sheet and Income Statement Belo Balance Sheet (00 Year 1 Year 2 Year 1 Year 2 Income Statement (0 Revenues by Geography Current Assets Cash 45,000 33,120 U.S. 270,000 288,000 Accounts Receivable 21,150 27,000 Europe 162,000 144,000 Inventories 16,200 19,800 Asia 108,000 180,000 Prepaid Expenses 4,500 2,700 Total Revenue 540,000 612,000 Other Current Assets 3,150 4,500 Total Current Assets 90,000 87,120 Cost of Revenues by Geography U.S. 108,000 115,200 Property and Equipment Europe 72,000 64,800 Land 1,350,000 1,350,000 Asia 54,000 90,000 Building 108,000 180,000 Total Cost of Revenue 234,000 270,000 72,000 90,000 Gross Profit 306,000 342,000 Furniture & Equipment Total Gross P&E Less Accumulated Depre Net P&E 1,530,000 1,620,000 (180,000) (225,000) 1,350,000 1,395,000 108,000 112,500 Operating Expenses EBITDA 198,000 229,500 Intagibles Assets 180,000 162,000 Depreciation 40,500 45,000 180,000 225,000 Amortization of Intagible 18,000 18,000 Long-Term Investments Total Assets 1,800,000 1,869,120 EBIT 139,500 166,500 Interest Expense 27,000 22,500 Liabilities and Owners Equity EBT 112,500 144,000 Current Liabilities Taxes 24,750 87,750 31,680 112,320 Accounts Payable 16,200 18,900 Net Income 6,300 9,000 Accrued Income Taxes Accrued Expenses 3,600 2,700 1,800 900 Other Current Liabilities Current Portion of Long Total Current Liabilities 8,100 9,900 36,000 41,400 513,900 423,900 Long-Term Debt: Deferred Income Taxes Total Liabilties 12,600 18,000 562,500 483,300 Owners' Equity Common Stock Paid-in-Capital 900,000 900,000 90,000 126,000 Retained Earnings 247,500 359,820 Total Owners' Equity 1,237,500 1,385,820 Total Liabilities & Owner's 1,800,000 1,869,120 OUTPUT Cash Flow Statement [000's) Year 2 Ratio Analysis Year 1 Year 2 OUTPUT Cash Flow Statement [000's) Het Income Plus Depreciation Plus Amortization on Intagibles Deffered Taxes Cash Income Working Capital Activities Accounts Receivable Inventory Prepaid Expenses Other Current Assets Accounts Payable Accrued Income Taxes Accrued Expenses Other Current Liabilities Total Change in Working Capital Operating Cash Flow (OCF) Investment Activities Capital Expenditures Investments (Change) Total Investment Activities Cash Available Before Financing Activities Financing Activities ST Debt Payments LT Payments Equity Contribution Total Financing Activities Free Cash Flow Beginning Cash Ending Cash Year 2 03,300 moo Year 1 Ratio Analysis US's Business Revenue Growth Asia's Business Gross Margin EBITDA Margin Accounts Receivable Days Inventory Days Quick Ratio ROE Total Debt/EBITDA (Leverage) Year 2 Day Day