Question
Context: The Inclusive Internet Index assesses and compares countries according to their readiness for the adoption and beneficial use of the internet. Its purpose is
Context: The Inclusive Internet Index assesses and compares countries according to their readiness for the adoption and beneficial use of the internet. Its purpose is to outline the current state of internet inclusion around the world and to help policymakers and influencers gain a clearer understanding of the factors that contribute to wider and sustainable inclusion. The Inclusive Internet Index is a study commissioned by Facebook and implemented by the Economist Intelligent Unit (use licenseLinks to an external site.).
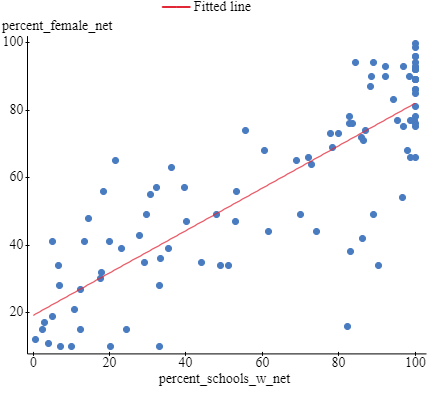
We'll use the raw data from 2019 or 2020 to determine which of two explanatory variables is the better predictor of the response variable.
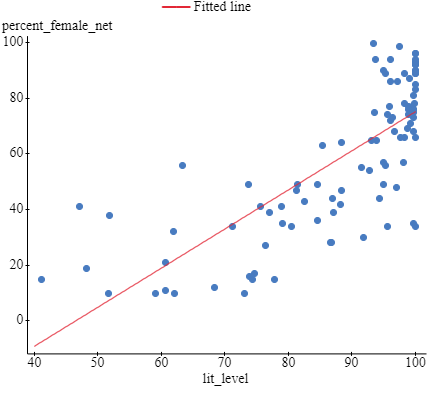
Variables: First explanatory variable: lit-level = the percentage of a country's population that can read and write Second explanatory variable: percent-schools-w-net = the percentage of a country's schools with student internet access Response variable: percent-female-net = the percentage of a country's female population with internet access Prompt: We'll use StatCrunch to produce the scatterplot with its least-squares regression line, the regression equation, r-squared, and the standard error for two different regression models. Then we'll determine which model is the best predictor of the response variable, percent-female-net.
Question 1
Simple linear regression results: Dependent Variable: percent_female_net Independent Variable: lit_level percent_female_net = -65.319759 + 1.4042321 lit_level Sample size: 100 R (correlation coefficient) = 0.76531853 R-sq = 0.58571246 Estimate of error standard deviation: 17.318237 Parameter estimates:
| Parameter | Estimate | Std. Err. | Alternative | DF | T-Stat | P-value |
|---|---|---|---|---|---|---|
| Intercept | -65.319759 | 10.682755 | ? 0 | 98 | -6.1145049 | |
| Slope | 1.4042321 | 0.11929839 | ? 0 | 98 | 11.770755 |
Analysis of variance table for regression model:
| Source | DF | SS | MS | F-stat | P-value |
|---|---|---|---|---|---|
| Model | 1 | 41554.306 | 41554.306 | 138.55068 | |
| Error | 98 | 29392.292 | 299.92134 | ||
| Total | 99 | 70946.598 |


Step by Step Solution
There are 3 Steps involved in it
Step: 1

Get Instant Access to Expert-Tailored Solutions
See step-by-step solutions with expert insights and AI powered tools for academic success
Step: 2

Step: 3

Ace Your Homework with AI
Get the answers you need in no time with our AI-driven, step-by-step assistance
Get Started


