

Answered step by step
Verified Expert Solution
Question
1 Approved Answer
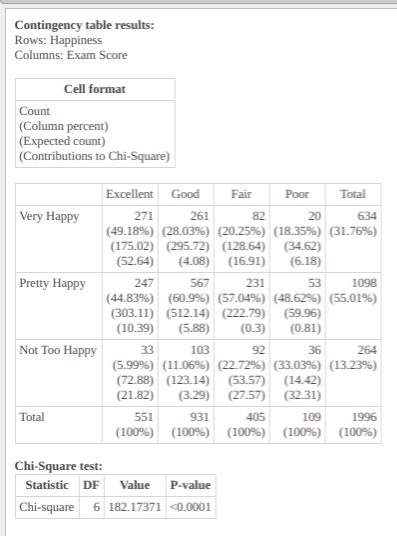
Contingency table results: Rows: Happiness Columns: Exam Score Cell format Count (Column percent) (Expected count) (Contributions to Chi-Square) Excellent Good Fair Poor Total Very Happy
Step by Step Solution
There are 3 Steps involved in it
Step: 1

Get Instant Access to Expert-Tailored Solutions
See step-by-step solutions with expert insights and AI powered tools for academic success
Step: 2

Step: 3
Ace Your Homework with AI
Get the answers you need in no time with our AI-driven, step-by-step assistance
Get Started
Essentials of Business Analytics
Authors: Jeffrey D. Camm, James J. Cochran, Michael J. Fry, Jeffrey W. Ohlmann, David R. Anderson
2nd edition
1305627733, 978-1305861817, 1305861817, 978-0357688960, 978-1305627734