Answered step by step
Verified Expert Solution
Link Copied!

Question

1 Approved Answer

continuous data that are normally distributed. 1. What about data that are not continuous and/or not normally distributed? 2. How would we test for differences

continuous data that are normally distributed.

1. What about data that are not continuous and/or not normally distributed?

2. How would we test for differences or analyze relationships in this case?

3. Describe, through an example, a variable that is not continuous in nature.

4. Next, describe a nonparametric test other than chi-square and what it is used for.

5. Think of a real-world example that would use the test they describe.
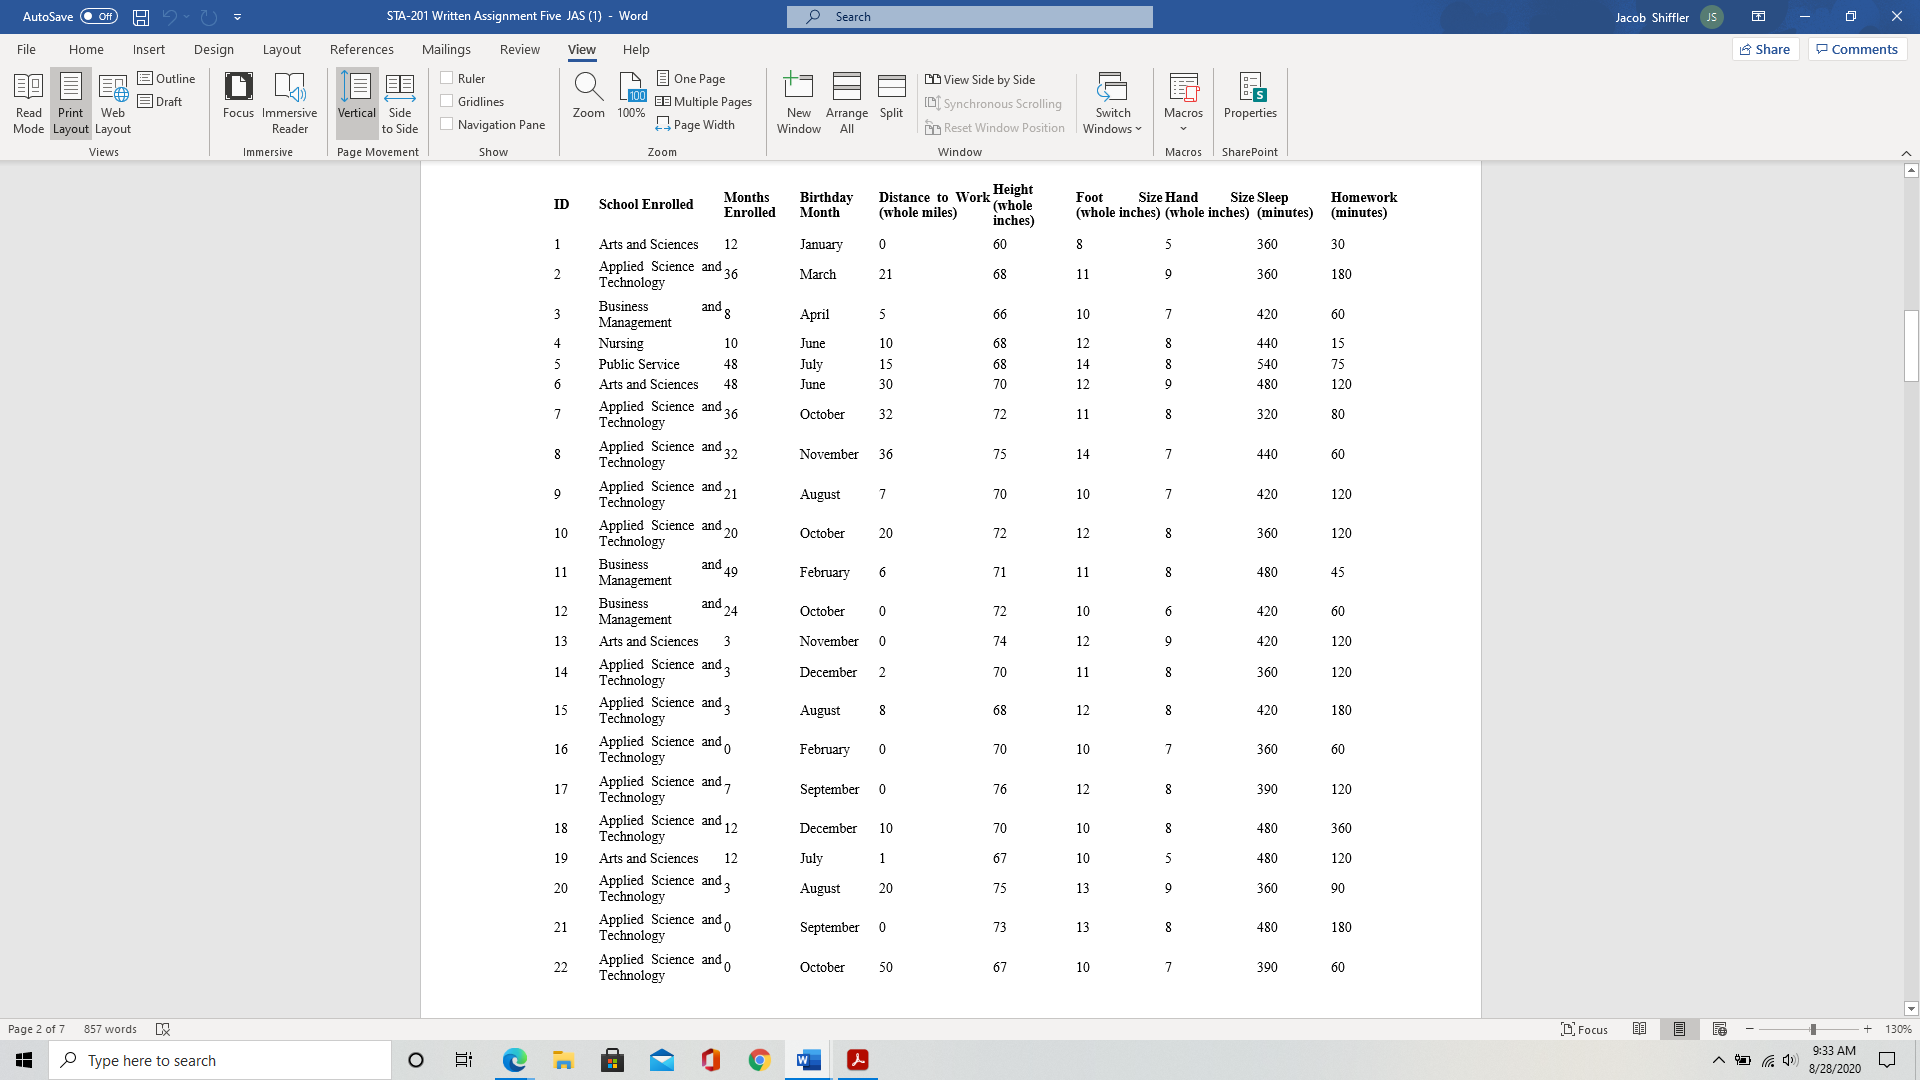
image text in transcribed
Jacob Shiffler JS X AutoSave . Off STA-201 Written Assignment Five JAS (1) - Word Search 15 Share Comments File Home Insert Design Layout References Mailings Review View Help 30 1 Outline Ruler One Page CO View Side by Side Draft Gridlines L 100 BE Multiple Pages IDI Synchronous Scrolling Switch Macros Properties Read Print Web Focus Immersive Vertical Side Navigation Pane Zoom 100% Page Width New Arrange Split Window All in Reset Window Position Windows Mode Layout Layout Reade Macros | SharePoint Views Immersive Page Movement Show Zoom Window Months Birthday Distance to Work Height (whole Foot Size Hand Size Sleep Homework ID School Enrolled Enrolled Month (whole miles) (whole inches) (whole inches) (minutes) (minutes) inches) 1 Arts and Sciences January 50 30 Applied Science and 36 360 180 Technology March 21 68 11 w Business 5 66 10 420 00 Management April Nursing June 10 68 12 140 75 Public Service July 15 68 14 540 30 70 12 480 120 Arts and Sciences 10 June Applied Science and 36 October 32 72 11 00 10 00 00 320 80 Technology 8 Applied Science and 32 November 36 75 14 440 60 Technology Applied Science and 21 70 10 120 Technology August 420 Applied Science and 20 October 20 72 12 360 120 10 Technology 180 15 11 Business February 71 11 Management 12 Business and 24 October 72 10 420 10 Management 13 November 74 12 420 120 Arts and Sciences 14 Applied Science and December 2 70 11 360 120 Technology 15 Applied Science and 420 Technology August 8 68 12 180 Applied Science and February C 70 10 360 60 16 Technology 17 Applied Science and- September 0 76 12 390 120 Technology 18 Applied Science and 12 December 10 70 10 480 360 Technology 10 Arts and Sciences 12 July 67 10 480 120 Applied Science and August 20 75 13 360 90 20 Technology Applied Science and September 0 73 13 00 180 180 21 Technology Applied Science and October 50 67 10 7 390 50 22 Technology Focus 9:33 AM Page 2 of 7 857 words X 8/28/2020 Type here to search O

Step by Step Solution

There are 3 Steps involved in it

Step: 1

blur-text-image

Get Instant Access to Expert-Tailored Solutions

See step-by-step solutions with expert insights and AI powered tools for academic success

Step: 2

blur-text-image

Step: 3

blur-text-image

Ace Your Homework with AI

Get the answers you need in no time with our AI-driven, step-by-step assistance

Get Started

Recommended Textbook for

Prealgebra

Authors: Elayn Martin Gay

7th edition

321955048, 978-0321955043

More Books

Students also viewed these Mathematics questions

Question

Understand the application of the at-risk rule to partnerships.

Answered: 1 week ago