

Answered step by step
Verified Expert Solution
Question
1 Approved Answer
Contribution Margin, Break-Even Sales, Cost-Volume-Profit Graph, and Operating Leverage 2. What is the expected contribution margin ratio? % 3. Determine the break-even sales in units
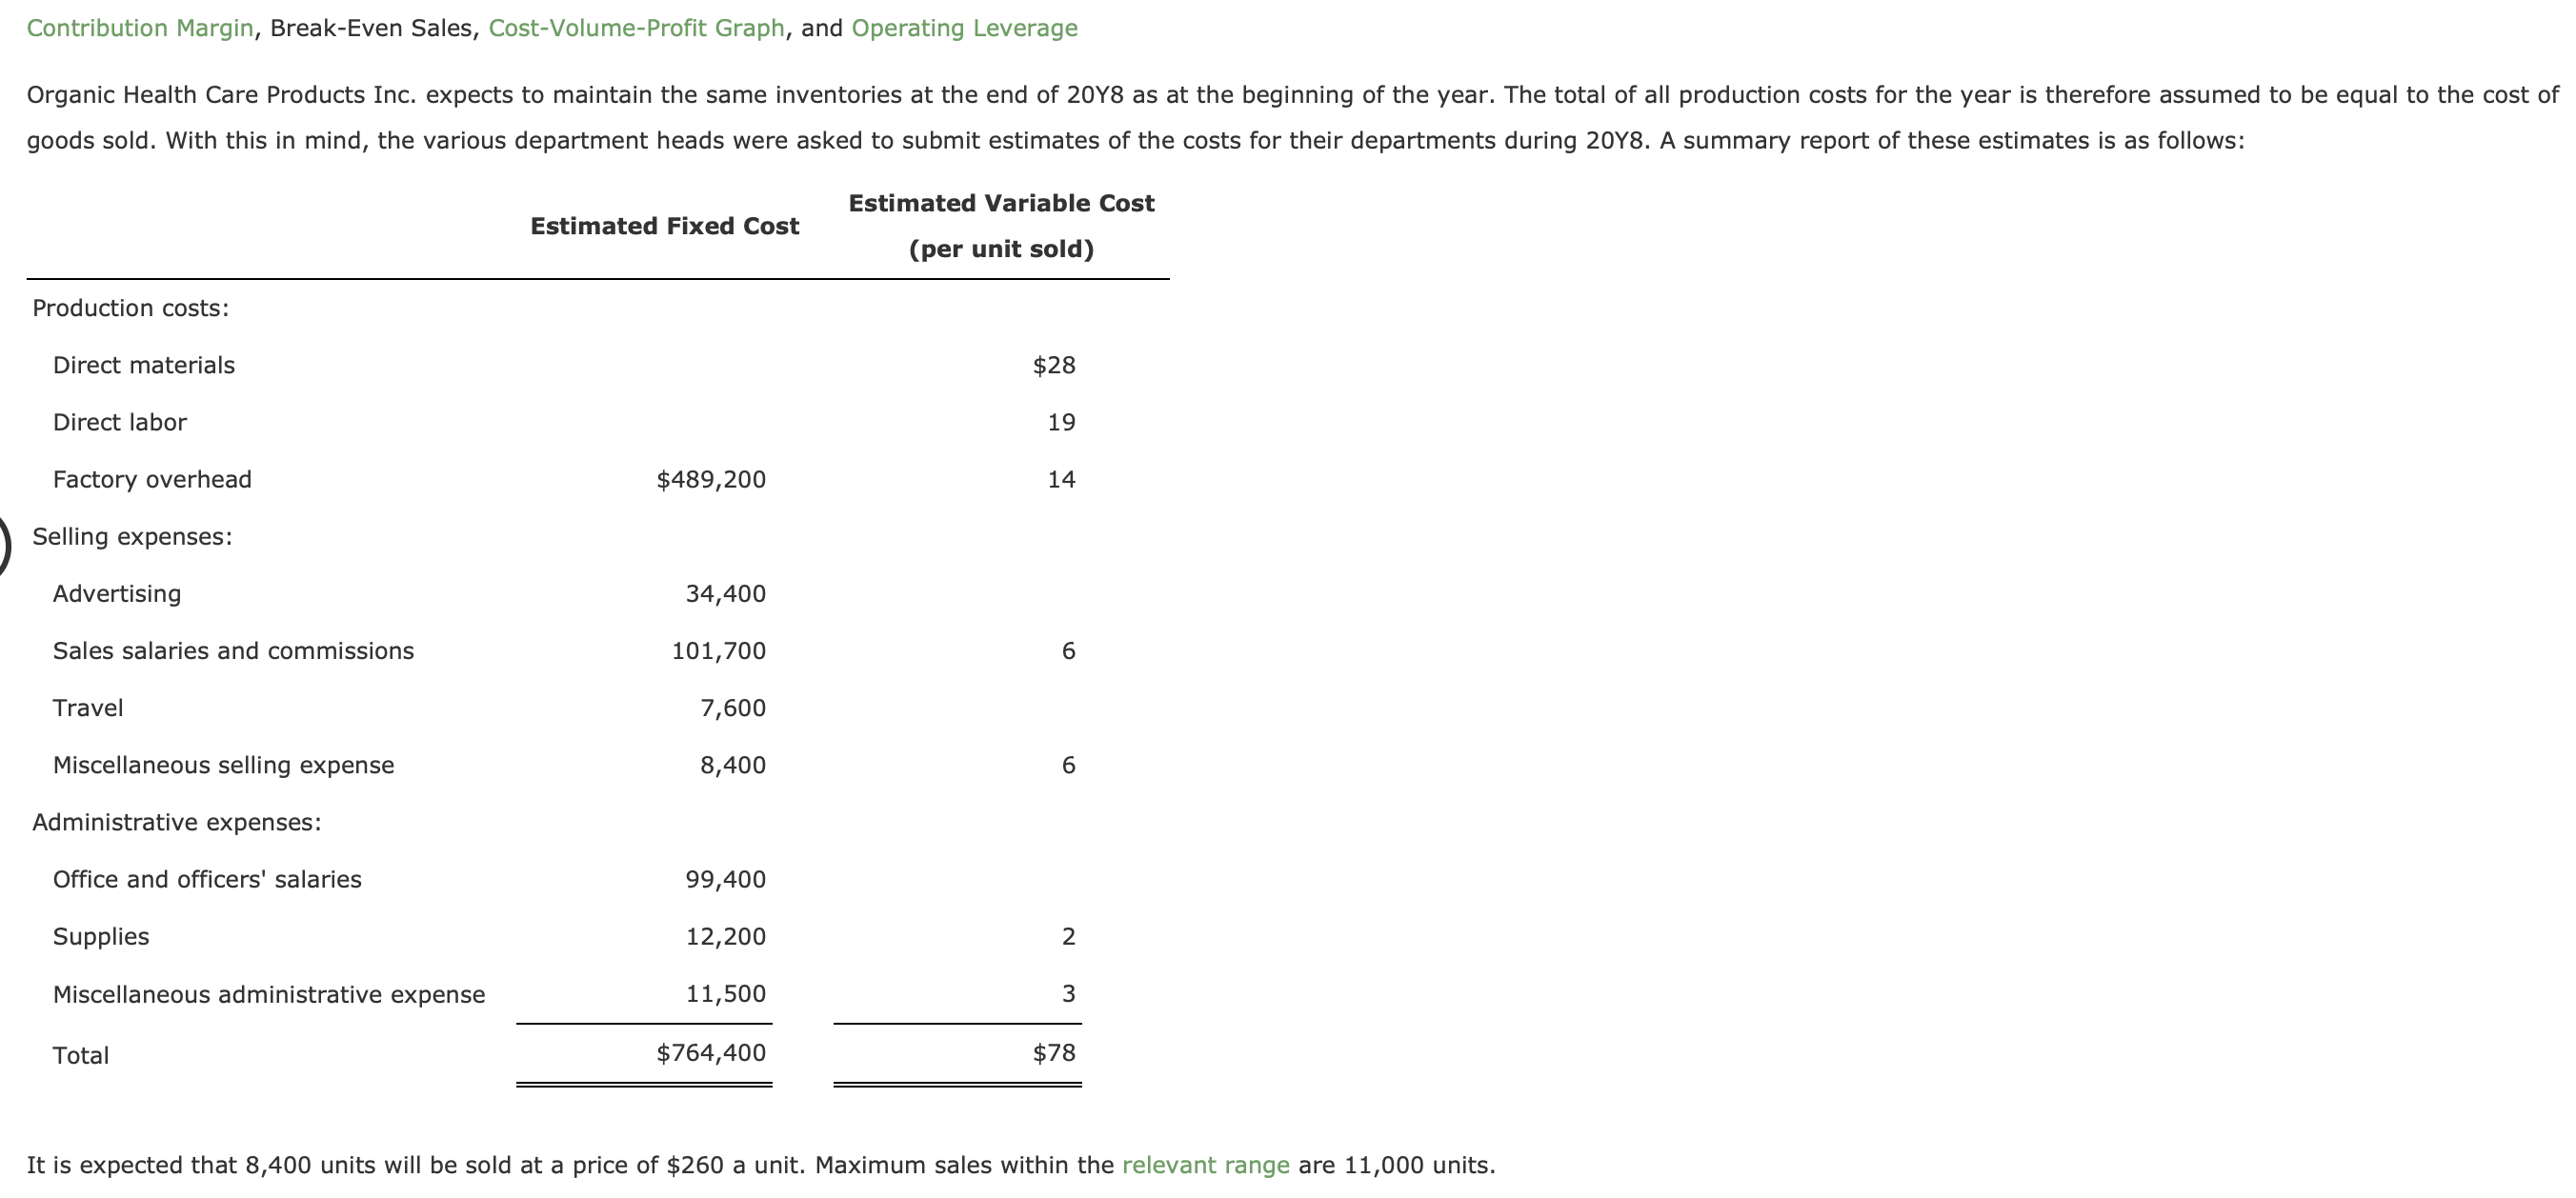
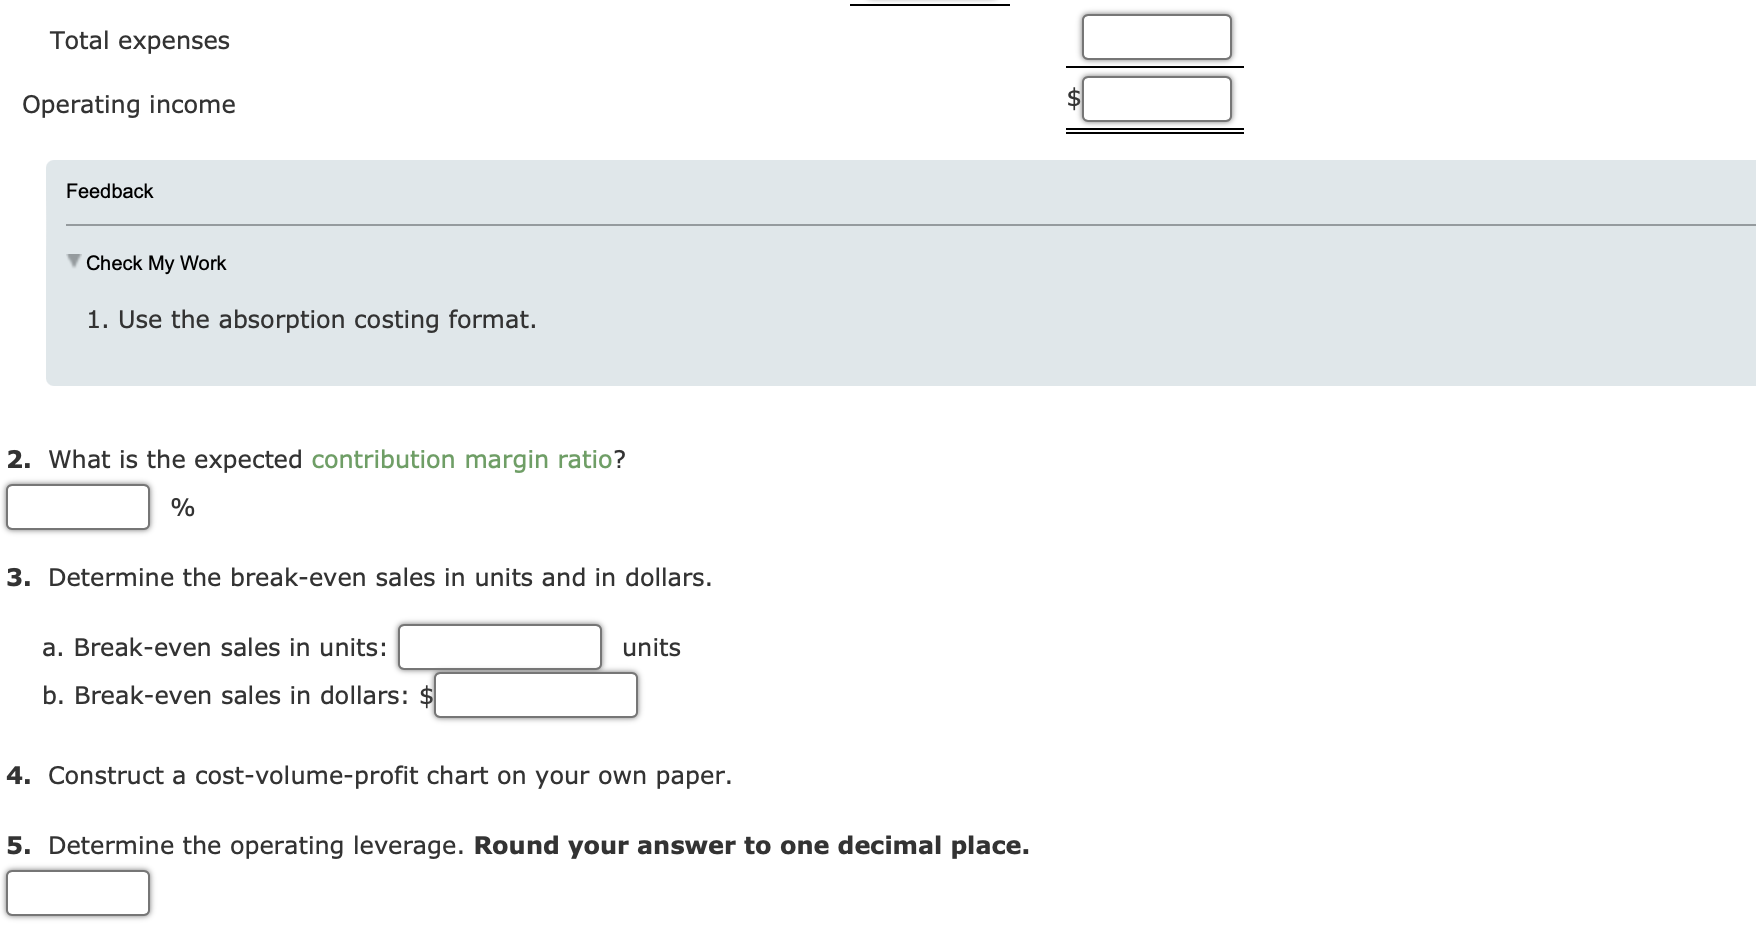
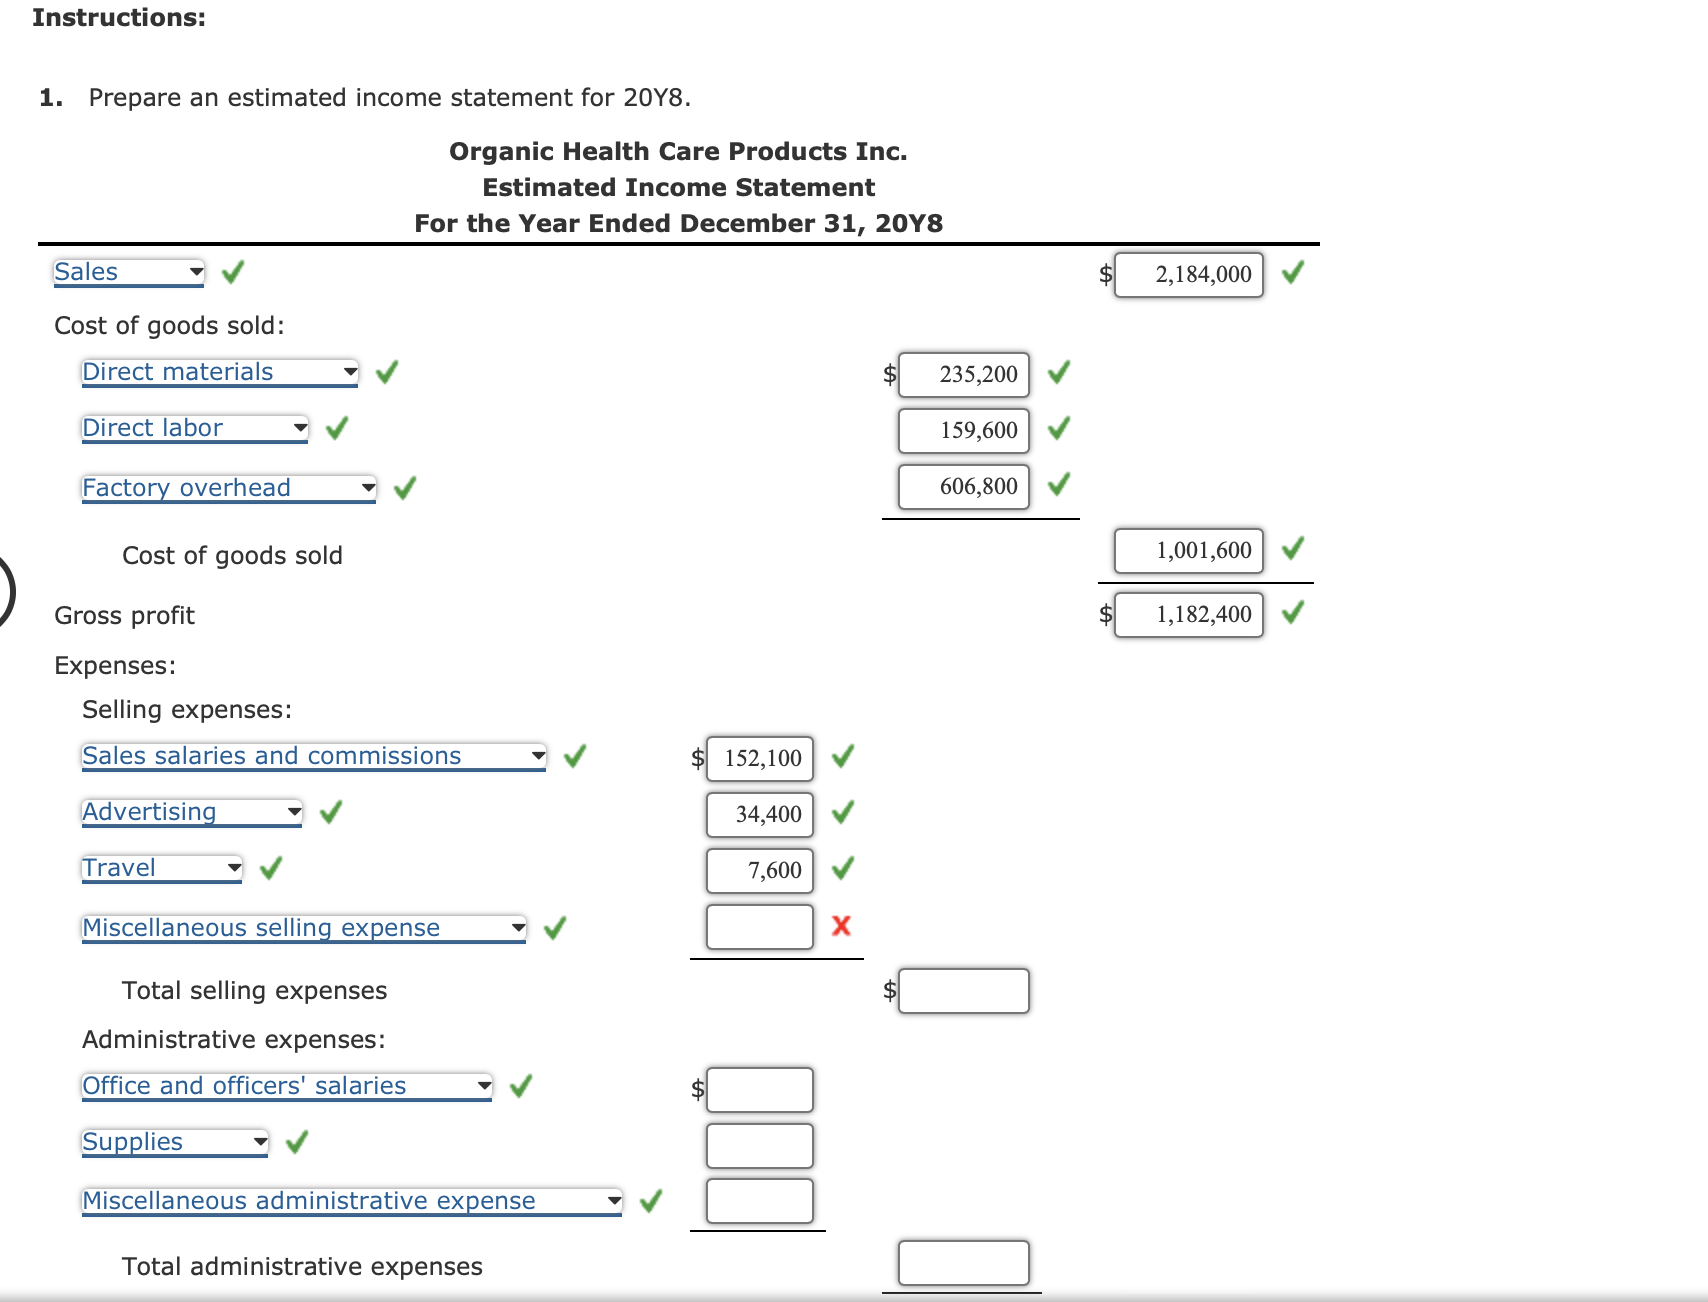 Contribution Margin, Break-Even Sales, Cost-Volume-Profit Graph, and Operating Leverage 2. What is the expected contribution margin ratio? % 3. Determine the break-even sales in units and in dollars. a. Break-even sales in units: units b. Break-even sales in dollars: $ 4. Construct a cost-volume-profit chart on your own paper. 5. Determine the operating leverage. Round your answer to one decimal place. Instructions: 1. Prepare an estimated income statement for 20Y8. Organic Health Care Products Inc. Estimated Income Statement For the Year Ended December 31, 20 Y8 Sales Cost of goods sold: Cost of goods sold Gross profit Expenses: Selling expenses: Sales salaries and commissions Advertising Travel Miscellaneous selling expense Total selling expenses Administrative expenses: Office and officers' salaries Supplies Miscellaneous administrative expense Total administrative expenses
Step by Step Solution
There are 3 Steps involved in it
Step: 1

Get Instant Access to Expert-Tailored Solutions
See step-by-step solutions with expert insights and AI powered tools for academic success
Step: 2

Step: 3
Ace Your Homework with AI
Get the answers you need in no time with our AI-driven, step-by-step assistance
Get Started
Computer Accounting With QuickBooks Pro 2010
Authors: Donna UlmerDonna Kay
12th Edition
0077408756, 9780077408756