Answered step by step
Verified Expert Solution
Question
1 Approved Answer
Copy+of+Returns+2009-18+-+50+Random+Cos+%26+50+Steel+Cos+2_harcode(1).xlsx Copy+of+Returns+2009-18+-+50+Random+Cos+%26+50+Steel+Cos+2_harcode 3 Copy+of+Returns+2009-18+-+50+Random+Cos+%26+50+Steel+Cos+2_harcode(1).xlsx Copy+of+Returns+2009-18+-+50+Random+Cos+%26+50+Steel+Cos+2_harcode(1).xlsx Instructions: This is a group assignment. Each group turns in one typed copy of their answers in the Assignment tab.
Copy+of+Returns+2009-18+-+50+Random+Cos+%26+50+Steel+Cos+2_harcode(1).xlsx
Copy+of+Returns+2009-18+-+50+Random+Cos+%26+50+Steel+Cos+2_harcode 3
Copy+of+Returns+2009-18+-+50+Random+Cos+%26+50+Steel+Cos+2_harcode(1).xlsx
Copy+of+Returns+2009-18+-+50+Random+Cos+%26+50+Steel+Cos+2_harcode(1).xlsx
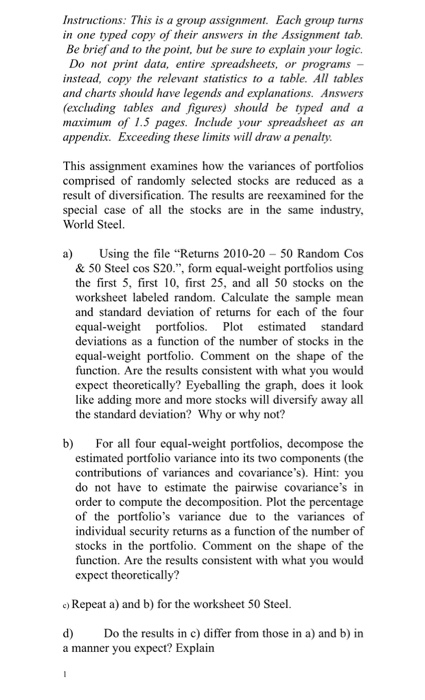
Instructions: This is a group assignment. Each group turns in one typed copy of their answers in the Assignment tab. Be brief and to the point, but be sure to explain your logic. Do not print data, entire spreadsheets, or programs - instead, copy the relevant statistics to a table. All tables and charts should have legends and explanations. Answers (excluding tables and figures) should be typed and a maximum of 1.5 pages. Include your spreadsheet as an appendix. Exceeding these limits will draw a penalty. This assignment examines how the variances of portfolios comprised of randomly selected stocks are reduced as a result of diversification. The results are reexamined for the special case of all the stocks are in the same industry, World Steel. a) Using the file "Returns 2010-20 - 50 Random Cos & 50 Steel cos S20.", form equal weight portfolios using the first 5, first 10, first 25, and all 50 stocks on the worksheet labeled random. Calculate the sample mean and standard deviation of returns for each of the four equal weight portfolios. Plot estimated standard deviations as a function of the number of stocks in the equal weight portfolio. Comment on the shape of the function. Are the results consistent with what you would expect theoretically? Eyeballing the graph, does it look like adding more and more stocks will diversify away all the standard deviation? Why or why not? b) For all four equal weight portfolios, decompose the estimated portfolio variance into its two components (the contributions of variances and covariance's). Hint: you do not have to estimate the pairwise covariance's in order to compute the decomposition. Plot the percentage of the portfolio's variance due to the variances of individual security returns as a function of the number of stocks in the portfolio. Comment on the shape of the function. Are the results consistent with what you would expect theoretically? c) Repeat a) and b) for the worksheet 50 Steel. d) Do the results in c) differ from those in a) and b) in a manner you expect? Explain Instructions: This is a group assignment. Each group turns in one typed copy of their answers in the Assignment tab. Be brief and to the point, but be sure to explain your logic. Do not print data, entire spreadsheets, or programs - instead, copy the relevant statistics to a table. All tables and charts should have legends and explanations. Answers (excluding tables and figures) should be typed and a maximum of 1.5 pages. Include your spreadsheet as an appendix. Exceeding these limits will draw a penalty. This assignment examines how the variances of portfolios comprised of randomly selected stocks are reduced as a result of diversification. The results are reexamined for the special case of all the stocks are in the same industry, World Steel. a) Using the file "Returns 2010-20 - 50 Random Cos & 50 Steel cos S20.", form equal weight portfolios using the first 5, first 10, first 25, and all 50 stocks on the worksheet labeled random. Calculate the sample mean and standard deviation of returns for each of the four equal weight portfolios. Plot estimated standard deviations as a function of the number of stocks in the equal weight portfolio. Comment on the shape of the function. Are the results consistent with what you would expect theoretically? Eyeballing the graph, does it look like adding more and more stocks will diversify away all the standard deviation? Why or why not? b) For all four equal weight portfolios, decompose the estimated portfolio variance into its two components (the contributions of variances and covariance's). Hint: you do not have to estimate the pairwise covariance's in order to compute the decomposition. Plot the percentage of the portfolio's variance due to the variances of individual security returns as a function of the number of stocks in the portfolio. Comment on the shape of the function. Are the results consistent with what you would expect theoretically? c) Repeat a) and b) for the worksheet 50 Steel. d) Do the results in c) differ from those in a) and b) in a manner you expect? Explain Step by Step Solution
There are 3 Steps involved in it
Step: 1

Get Instant Access to Expert-Tailored Solutions
See step-by-step solutions with expert insights and AI powered tools for academic success
Step: 2

Step: 3
Ace Your Homework with AI
Get the answers you need in no time with our AI-driven, step-by-step assistance
Get Started