Answered step by step
Verified Expert Solution
Question
1 Approved Answer
Cost Accounting Indirect Manufacturing Expenses The Industrial Plastics Company manufactures three different models, called L-6, L-8 and L-12. For next year, the budgeted data regarding
Cost Accounting
Indirect Manufacturing Expenses
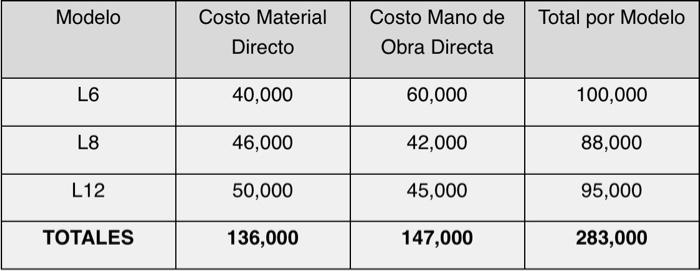
The Industrial Plastics Company manufactures three different models, called L-6, L-8 and L-12. For next year, the budgeted data regarding the prime cost of the three models is as follows:

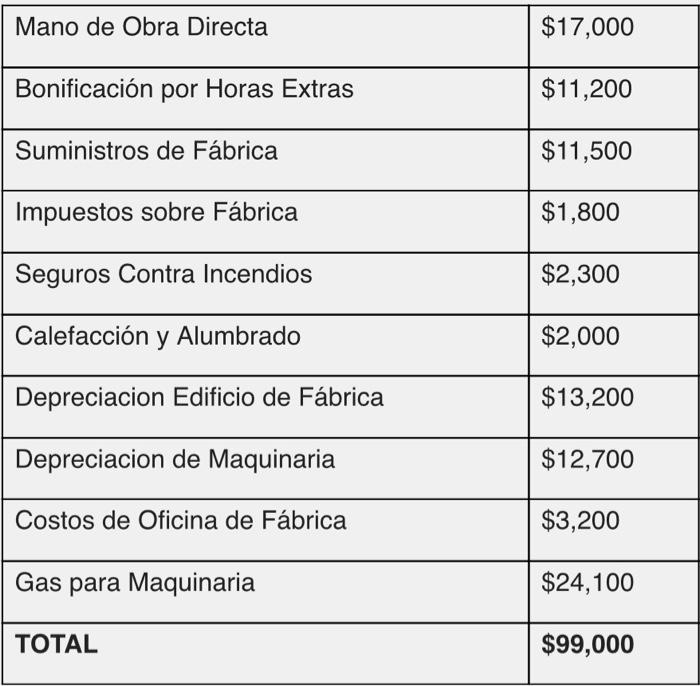
Regarding common manufacturing costs, the budget indicated the following amounts:

Using the information above, do the following:
1.Prepare a chart or table illustrating the distribution of common manufacturing costs based on raw material cost and showing, for each of the models, the cost structure, gross profit, and selling price, assuming that the gross profit on production cost for each model is: L6 20%, L8 30%, and L12 25%.
2.Create a second chart or table illustrating the distribution of common manufacturing costs on a direct labor cost basis and showing, for each of the models, the cost structure, gross profit, and selling price. assuming that the gross profit over the cost of production for each model is: L6 20%, L8 30%, and L12 25%.
3.Construct a third chart or table illustrating the distribution of common manufacturing costs on a prime cost basis and showing, for each of the models, the cost structure, gross profit, and selling price, assuming gross profit on the production cost for each model is: L6 20%, L8 30% and L12 25%.
here is the data of the images in english 


Indirect Manufacturing Expenses
The Industrial Plastics Company manufactures three different models, called L-6, L-8 and L-12. For next year, the budgeted data regarding the prime cost of the three models is as follows:

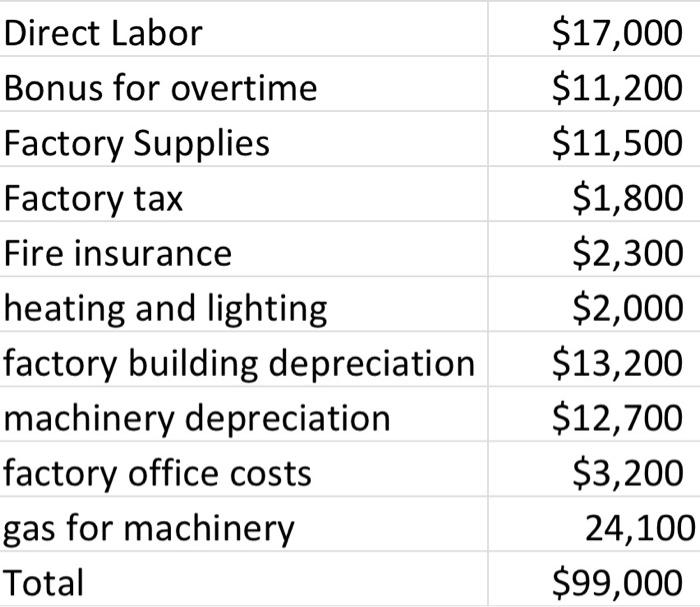
Regarding common manufacturing costs, the budget indicated the following amounts:

Using the information above, do the following:
1. Prepare a chart or table illustrating the distribution of common manufacturing costs based on raw material cost and showing, for each of the models, the cost structure, gross profit, and selling price, assuming that the gross profit on production cost for each model is: L6 20%, L8 30%, and L12 25%.
2. Create a second chart or table illustrating the distribution of common manufacturing costs on a direct labor cost basis and showing, for each of the models, the cost structure, gross profit, and selling price. assuming that the gross profit over the cost of production for each model is: L6 20%, L8 30%, and L12 25%.
3. Construct a third chart or table illustrating the distribution of common manufacturing costs on a prime cost basis and showing, for each of the models, the cost structure, gross profit, and selling price, assuming gross profit on the production cost for each model is: L6 20%, L8 30% and L12 25%.
Step by Step Solution
There are 3 Steps involved in it
Step: 1

Get Instant Access to Expert-Tailored Solutions
See step-by-step solutions with expert insights and AI powered tools for academic success
Step: 2

Step: 3

Ace Your Homework with AI
Get the answers you need in no time with our AI-driven, step-by-step assistance
Get Started


