

Answered step by step
Verified Expert Solution
Question
1 Approved Answer
Cost of Capital 4.00 Use however many columns you need. Make sure your computed price works not matter what I change the n to. t
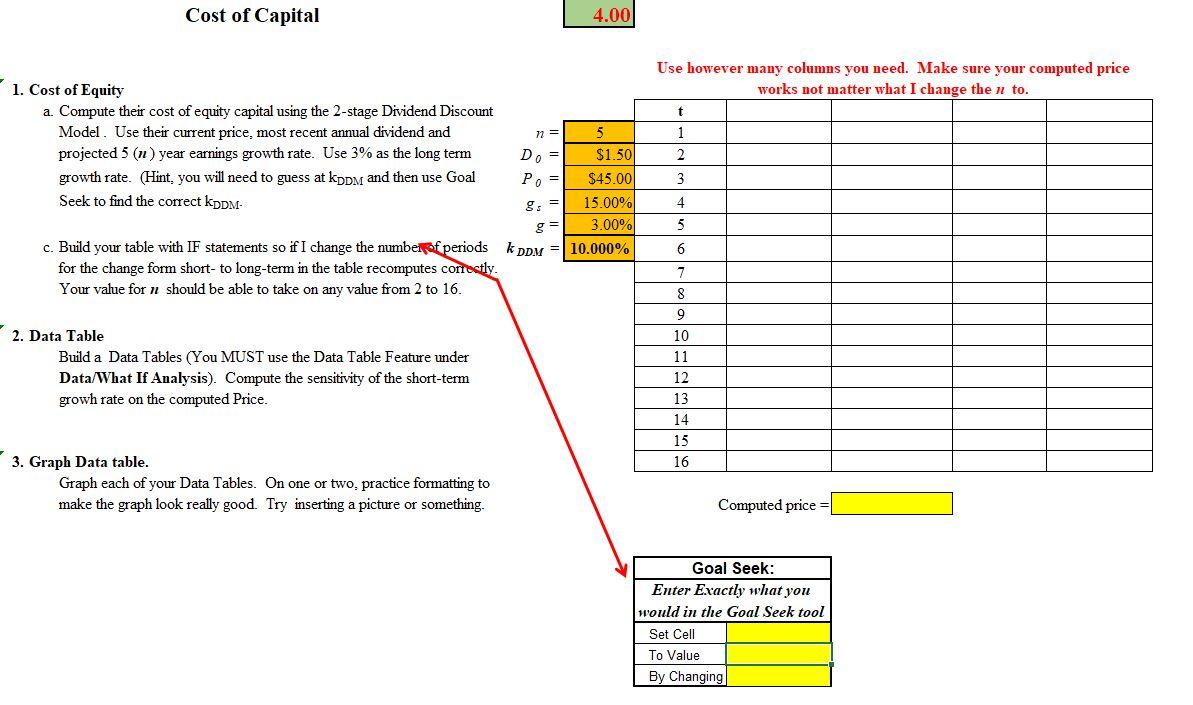
Cost of Capital 4.00 Use however many columns you need. Make sure your computed price works not matter what I change the n to. t n = 1 2 1. Cost of Equity a. Compute their cost of equity capital using the 2-stage Dividend Discount Model. Use their current price, most recent annual dividend and 5 projected 5 (n) year earnings growth rate. Use 3% as the long term Do = $1.500 growth rate. (Hint, you will need to guess at kpd and then use Goal Po = $45.00 Seek to find the correct KDDM- g. 15.00% 3.00% c. Build your table with IF statements so if I change the number of periods k DDM = 10.000% for the change form short- to long-term in the table recomputes correctly. Your value for n should be able to take on any value from 2 to 16. 3 4 5 6 2. Data Table Build a Data Tables (You MUST use the Data Table Feature under Data/What If Analysis). Compute the sensitivity of the short-term growh rate on the computed Price. 7 7 8 9 10 11 12 13 14 15 16 3. Graph Data table. Graph each of your Data Tables. On one or two, practice formatting to make the graph look really good. Try inserting a picture or something. Computed price Goal Seek: Enter Exactly what you would in the Goal Seek tool Set Cell To Value By Changing Cost of Capital 4.00 Use however many columns you need. Make sure your computed price works not matter what I change the n to. t n = 1 2 1. Cost of Equity a. Compute their cost of equity capital using the 2-stage Dividend Discount Model. Use their current price, most recent annual dividend and 5 projected 5 (n) year earnings growth rate. Use 3% as the long term Do = $1.500 growth rate. (Hint, you will need to guess at kpd and then use Goal Po = $45.00 Seek to find the correct KDDM- g. 15.00% 3.00% c. Build your table with IF statements so if I change the number of periods k DDM = 10.000% for the change form short- to long-term in the table recomputes correctly. Your value for n should be able to take on any value from 2 to 16. 3 4 5 6 2. Data Table Build a Data Tables (You MUST use the Data Table Feature under Data/What If Analysis). Compute the sensitivity of the short-term growh rate on the computed Price. 7 7 8 9 10 11 12 13 14 15 16 3. Graph Data table. Graph each of your Data Tables. On one or two, practice formatting to make the graph look really good. Try inserting a picture or something. Computed price Goal Seek: Enter Exactly what you would in the Goal Seek tool Set Cell To Value By Changing
Step by Step Solution
There are 3 Steps involved in it
Step: 1

Get Instant Access to Expert-Tailored Solutions
See step-by-step solutions with expert insights and AI powered tools for academic success
Step: 2

Step: 3
Ace Your Homework with AI
Get the answers you need in no time with our AI-driven, step-by-step assistance
Get Started
Numerical Solution Of The American Option Pricing Problem Finite Difference And Transform Approaches
Authors: Carl Chiarella, Boda Kang , Gunter H Meyer
1st Edition
9814452610,9814452637