Answered step by step
Verified Expert Solution
Question
1 Approved Answer
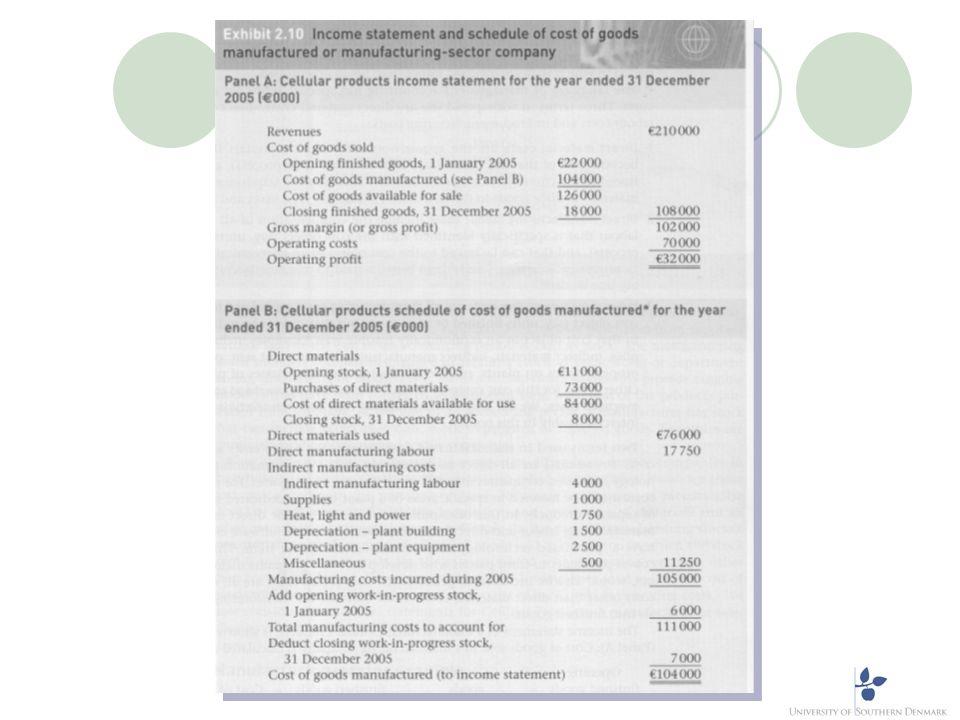
Exhibit 2.10 Income statement and schedule of cost of goods manufactured or manufacturing-sector company Panel A: Cellular products income statement for the year ended

Exhibit 2.10 Income statement and schedule of cost of goods manufactured or manufacturing-sector company Panel A: Cellular products income statement for the year ended 31 December 2005 (000) Revenues 210000 Cost of goods sold Opening finished goods, 1 January 2005 Cost of goods manufactured (see Panel B) Cost of goods available for sale Closing finished goods, 31 December 2005 Gross margin (or gross profit) Operating costs Operating profit 22000 104000 126000 18000 108000 102000 70000 32000 Panel B: Cellular products schedule of cost of goods manufactured for the year ended 31 December 2005 (000) Direct materials Opening stock, 1 January 2005 Purchases of direct materials Cost of direct materials available for use 11000 73000 84 000 Closing stock, 31 December 2005 Direct materials used 8000 76000 17750 Direct manufacturing labour Indirect manufacturing costs Indirect manufacturing labour Supplies Heat, light and power Depreciation- plant building Depreciation - plant equipment Miscellaneous Manufacturing costs incurred during 2005 Add opening work-in-progress stock, 1 January 2005 Total manufacturing costs to account for Deduct closing work-in-progress stock, 31 December 200S Cost of goods manufactured (to income statement) 4000 1000 1750 1 500 2500 500 11250 105 000 6000 111000 7000 104000 UNIVERSITY OF SOUTHERN DENMARK Exhibit 2.10 Income statement and schedule of cost of goods manufactured or manufacturing-sector company Panel A: Cellular products income statement for the year ended 31 December 2005 (000) Revenues 210000 Cost of goods sold Opening finished goods, 1 January 2005 Cost of goods manufactured (see Panel B) Cost of goods available for sale Closing finished goods, 31 December 2005 Gross margin (or gross profit) Operating costs Operating profit 22000 104000 126000 18000 108000 102000 70000 32000 Panel B: Cellular products schedule of cost of goods manufactured for the year ended 31 December 2005 (000) Direct materials Opening stock, 1 January 2005 Purchases of direct materials Cost of direct materials available for use 11000 73000 84 000 Closing stock, 31 December 2005 Direct materials used 8000 76000 17750 Direct manufacturing labour Indirect manufacturing costs Indirect manufacturing labour Supplies Heat, light and power Depreciation- plant building Depreciation - plant equipment Miscellaneous Manufacturing costs incurred during 2005 Add opening work-in-progress stock, 1 January 2005 Total manufacturing costs to account for Deduct closing work-in-progress stock, 31 December 200S Cost of goods manufactured (to income statement) 4000 1000 1750 1 500 2500 500 11250 105 000 6000 111000 7000 104000 UNIVERSITY OF SOUTHERN DENMARK Exhibit 2.10 Income statement and schedule of cost of goods manufactured or manufacturing-sector company Panel A: Cellular products income statement for the year ended 31 December 2005 (000) Revenues 210000 Cost of goods sold Opening finished goods, 1 January 2005 Cost of goods manufactured (see Panel B) Cost of goods available for sale Closing finished goods, 31 December 2005 Gross margin (or gross profit) Operating costs Operating profit 22000 104000 126000 18000 108000 102000 70000 32000 Panel B: Cellular products schedule of cost of goods manufactured for the year ended 31 December 2005 (000) Direct materials Opening stock, 1 January 2005 Purchases of direct materials Cost of direct materials available for use 11000 73000 84 000 Closing stock, 31 December 2005 Direct materials used 8000 76000 17750 Direct manufacturing labour Indirect manufacturing costs Indirect manufacturing labour Supplies Heat, light and power Depreciation- plant building Depreciation - plant equipment Miscellaneous Manufacturing costs incurred during 2005 Add opening work-in-progress stock, 1 January 2005 Total manufacturing costs to account for Deduct closing work-in-progress stock, 31 December 200S Cost of goods manufactured (to income statement) 4000 1000 1750 1 500 2500 500 11250 105 000 6000 111000 7000 104000 UNIVERSITY OF SOUTHERN DENMARK
Step by Step Solution
There are 3 Steps involved in it
Step: 1
Sol Step 1Information Given Beginning Inventory 22000 Cost goods of Manufacture...
Get Instant Access to Expert-Tailored Solutions
See step-by-step solutions with expert insights and AI powered tools for academic success
Step: 2

Step: 3

Ace Your Homework with AI
Get the answers you need in no time with our AI-driven, step-by-step assistance
Get Started


