Answered step by step
Verified Expert Solution
Question
1 Approved Answer
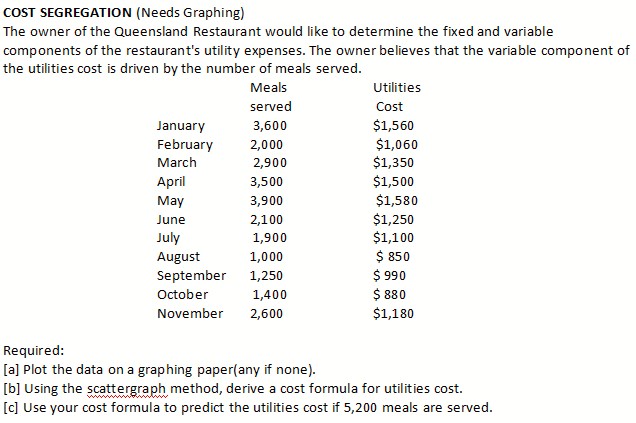
COST SEGREGATION (Needs Graphing) The owner of the Queensland Restaurant would like to determine the fixed and variable components of the restaurant's utility expenses.

COST SEGREGATION (Needs Graphing) The owner of the Queensland Restaurant would like to determine the fixed and variable components of the restaurant's utility expenses. The owner believes that the variable component of the utilities cost is driven by the number of meals served. Meals served Utilities Cost January 3,600 $1,560 February 2,000 $1,060 March 2,900 $1,350 April 3,500 $1,500 May 3,900 $1,580 June 2,100 $1,250 July 1,900 $1,100 August 1,000 $ 850 September 1,250 $ 990 October 1,400 $880 November 2,600 $1,180 Required: [a] Plot the data on a graphing paper(any if none). [b] Using the scattergraph method, derive a cost formula for utilities cost. [c] Use your cost formula to predict the utilities cost if 5,200 meals are served.
Step by Step Solution
There are 3 Steps involved in it
Step: 1
a Since I cant generate images you can plot the data on a g...
Get Instant Access to Expert-Tailored Solutions
See step-by-step solutions with expert insights and AI powered tools for academic success
Step: 2

Step: 3

Ace Your Homework with AI
Get the answers you need in no time with our AI-driven, step-by-step assistance
Get Started


