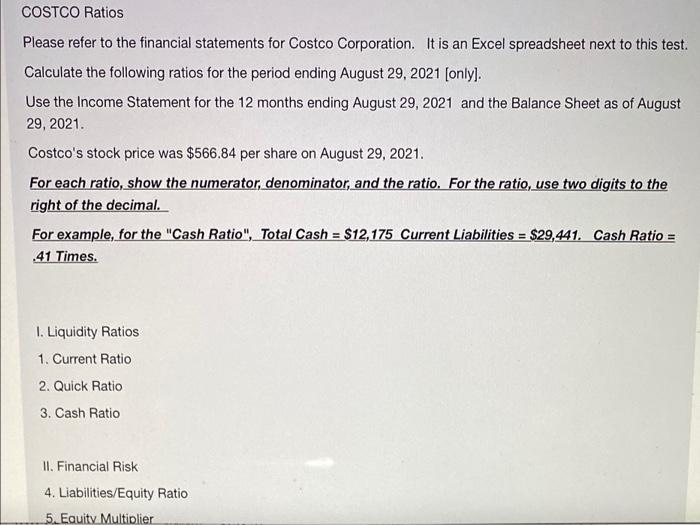
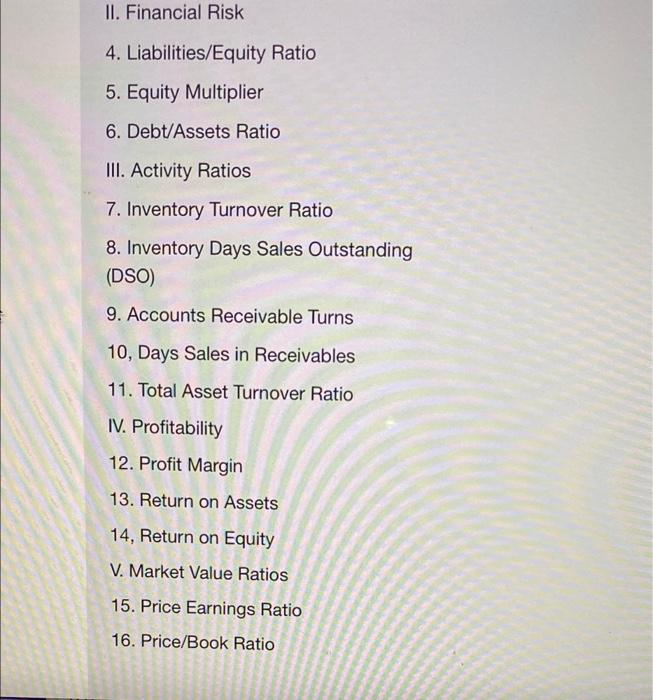
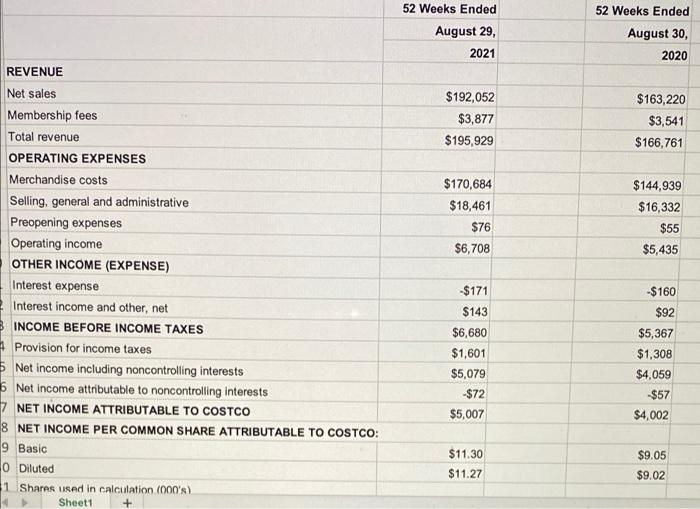
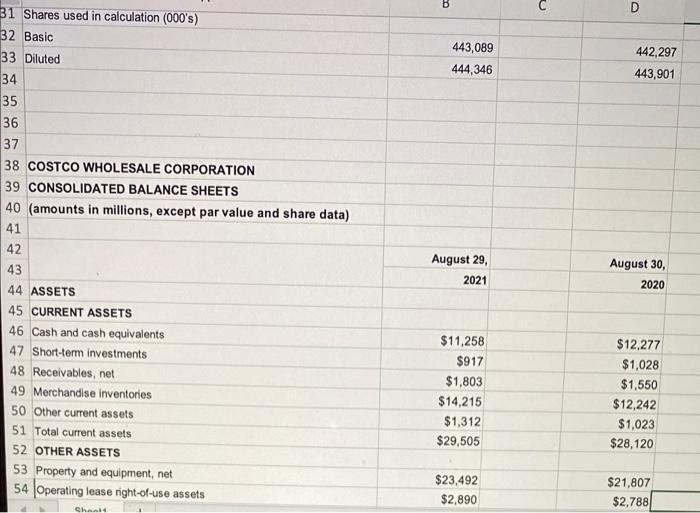
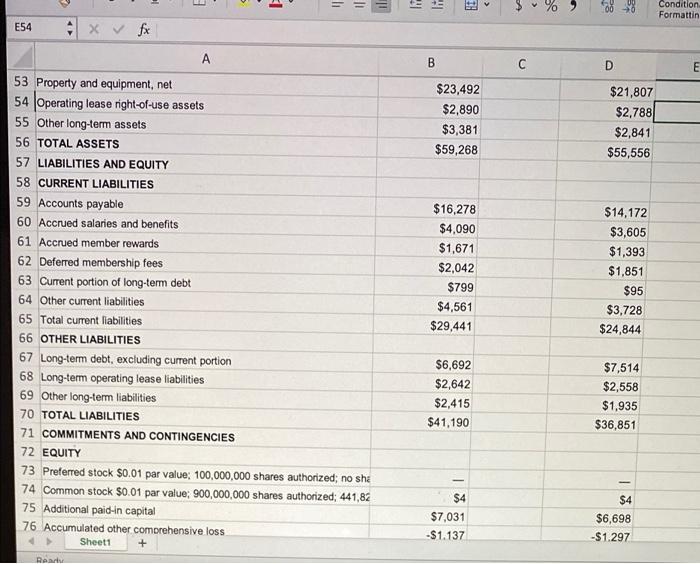
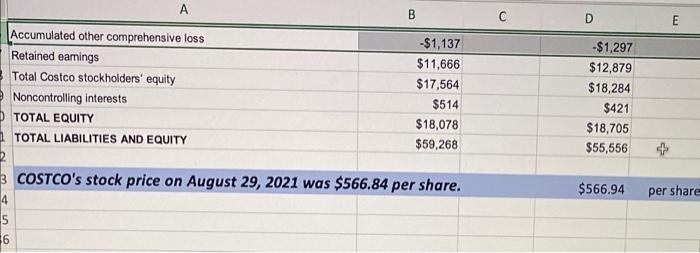
COSTCO Ratios Please refer to the financial statements for Costco Corporation. It is an Excel spreadsheet next to this test. Calculate the following ratios for the period ending August 29, 2021 (only). Use the Income Statement for the 12 months ending August 29, 2021 and the Balance Sheet as of August 29, 2021. Costco's stock price was $566.84 per share on August 29, 2021. For each ratio, show the numerator, denominator, and the ratio. For the ratio, use two digits to the right of the decimal. For example, for the "Cash Ratio", Total Cash = $12,175 Current Liabilities = $29,441. Cash Ratio = .41 Times. 1. Liquidity Ratios 1. Current Ratio 2. Quick Ratio 3. Cash Ratio II. Financial Risk 4. Liabilities/Equity Ratio 5. Equity Multiplier II. Financial Risk 4. Liabilities/Equity Ratio 5. Equity Multiplier 6. Debt/Assets Ratio III. Activity Ratios 7. Inventory Turnover Ratio 8. Inventory Days Sales Outstanding (DSO) 9. Accounts Receivable Turns 10, Days Sales in Receivables 11. Total Asset Turnover Ratio IV. Profitability 12. Profit Margin 13. Return on Assets 14, Return on Equity V. Market Value Ratios 15. Price Earnings Ratio 16. Price/Book Ratio 52 Weeks Ended 52 Weeks Ended August 29, 2021 August 30, 2020 REVENUE $192,052 $3,877 $195,929 $163,220 $3,541 $166,761 $144,939 $16,332 $170,684 $18.461 $76 $6,708 $55 $5,435 Net sales Membership fees Total revenue OPERATING EXPENSES Merchandise costs Selling, general and administrative Preopening expenses Operating income OTHER INCOME (EXPENSE) Interest expense Interest income and other, net INCOME BEFORE INCOME TAXES + Provision for income taxes Net income including noncontrolling interests 6 Net income attributable to noncontrolling interests 7 NET INCOME ATTRIBUTABLE TO COSTCO 8 NET INCOME PER COMMON SHARE ATTRIBUTABLE TO COSTCO: 9 Basic O Diluted 1 Shares used in calculation (000's) Sheet1 $171 $143 $6,680 $1,601 $5,079 -$72 $5,007 $160 $92 $5,367 $1,308 $4,059 $57 $4,002 $11.30 $11.27 $9.05 $9.02 B D 31 Shares used in calculation (000's) 32 Basic 33 Diluted 34 443,089 444,346 442,297 443,901 35 co 36 37 38 COSTCO WHOLESALE CORPORATION 39 CONSOLIDATED BALANCE SHEETS 40 (amounts in millions, except par value and share data) 41 42 43 August 29, 2021 August 30, 2020 44 ASSETS 45 CURRENT ASSETS 46 Cash and cash equivalents 47 Short-term investments 48 Receivables, net 49 Merchandise inventories 50 Other current assets 51 Total current assets 52 OTHER ASSETS 53 Property and equipment, net 54 Operating lease right-of-use assets $11,258 $917 $1,803 $14,215 $1,312 $29,505 $12,277 $1,028 $1,550 $12,242 $1,023 $28,120 $23,492 $2,890 $21,807 $2,788 Chand E 1 = = = 12 Condition Formattin E54 x x A B D E $23,492 $2,890 $3,381 $59,268 $21,807 $2,788 $2,841 $55,556 53 Property and equipment, net 54 Operating lease right-of-use assets 55 Other long-term assets 56 TOTAL ASSETS 57 LIABILITIES AND EQUITY 58 CURRENT LIABILITIES 59 Accounts payable 60 Accrued salaries and benefits 61 Accrued member rewards 62 Deferred membership fees 63 Current portion of long-term debt 64 Other current liabilities 65 Total current liabilities 66 OTHER LIABILITIES 67 Long-term debt, excluding current portion 68 Long-term operating lease liabilities 69 Other long-term liabilities 70 TOTAL LIABILITIES 71 COMMITMENTS AND CONTINGENCIES 72 EQUITY 73 Preferred stock $0.01 par value: 100,000,000 shares authorized; no she 74 Common stock $0.01 par value: 900,000,000 shares authorized: 441,82 75 Additional paid-in capital 76 Accumulated other comprehensive loss Sheet1 + $16,278 $4,090 $1,671 $2,042 $799 $4,561 $29,441 $14,172 $3,605 $1,393 $1,851 $95 $3,728 $24,844 $6,692 $2,642 $2,415 $41,190 $7,514 $2,558 $1,935 $36,851 I $4 $7,031 -$1.137 $4 $6,698 -$1.297 RAD C D E A B Accumulated other comprehensive loss -$1,137 Retained earnings $11,666 Total Costco stockholders' equity $17,564 Noncontrolling interests $514 TOTAL EQUITY $18,078 TOTAL LIABILITIES AND EQUITY $59,268 3 COSTCO's stock price on August 29, 2021 was $566.84 per share. 4 5 6 -$1,297 $12,879 $18,284 $421 $18,705 $55,556 $566.94 per share
