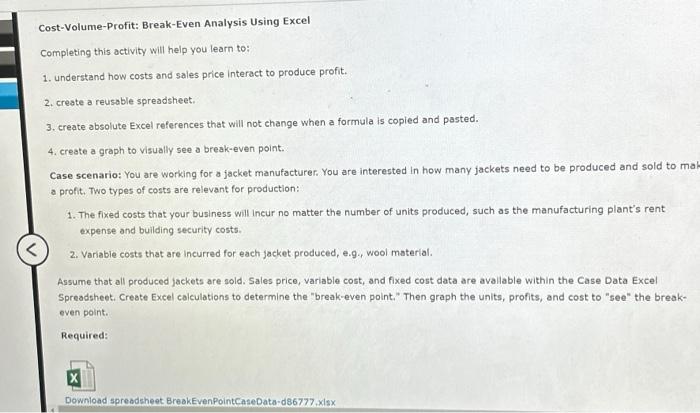
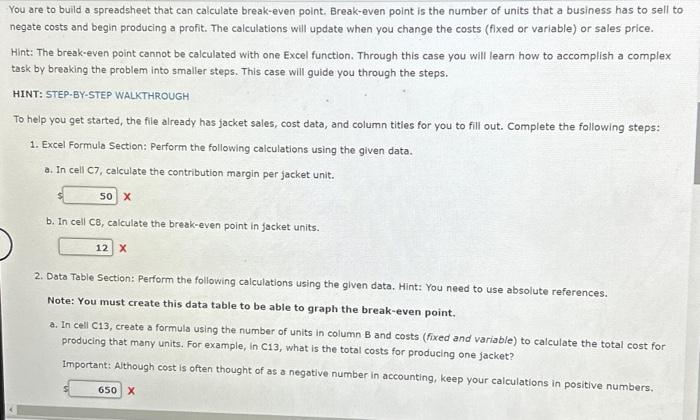
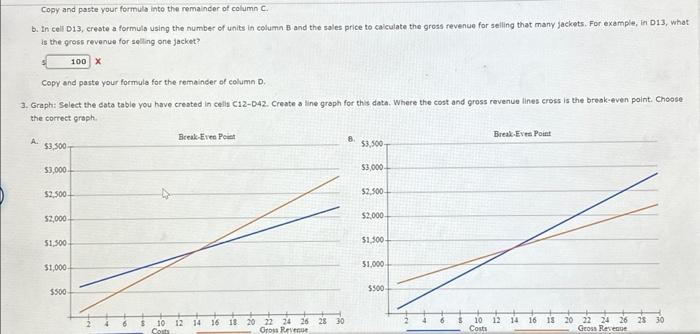
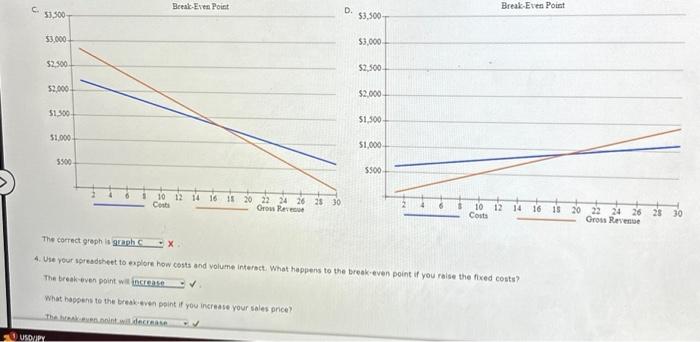
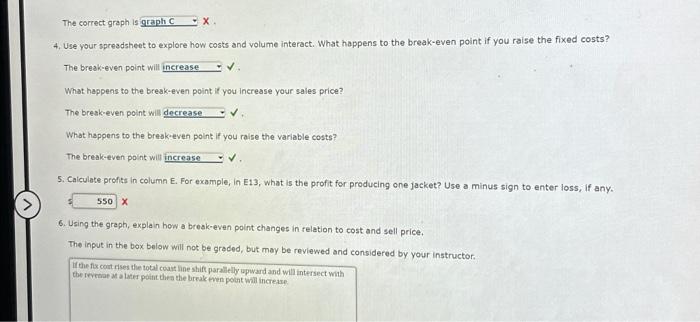
Cost-Volume-Profit: Break-Even Analysis Using Excel Completing this activity will help you learn to: 1. understand how costs and sales price interact to produce profit. 2. create a reusable spreadsheet. 3. create absolute Excel references that will not change when a formula is copied and pasted. 4. create a graph to visually see a break-even point. Case scenario: You are working for a jacket manufacturer. You are interested in how many jackets need to be produced and sold to ma a profit. Two types of costs are relevant for production: 1. The fixed costs that your business will incur no matter the number of units produced, such as the manufacturing plant's rent expense and building security costs. 2. Variable costs that are incurred for each jacket produced, e.9. wool material. Assume that all produced jackets are sold. Sales price, variable cost, and fixed cost data are avallable within the Case Data Excel Spreadsheet. Create Excel calculations to determine the "break-even point," Then graph the units, profits, and cost to "see" the breakeven point. Required: You are to build a spreadsheet that can calculate break-even point. Break-even point is the number of units that a business has to sell negate costs and begin producing a profit. The calculations will update when you change the costs (fixed or variable) or sales price. Hint: The break-even point cannot be calculated with one Excel function. Through this case you will learn how to accomplish a complex task by breaking the problem into smaller steps. This case will guide you through the steps. HINT: STEP-BY-STEP WALKTHROUGH To help you get started, the file already has jacket sales, cost data, and column tities for you to fill out. Complete the following steps: 1. Excel Formula Section: Perform the following calculations using the given data. a. In cell C7, calculate the contribution margin per jacket unit. b. In cell C8, calculate the break-even point in facket units. 2. Data Table Section: Perform the following calculations using the given data. Hint: You need to use absolute references. Note: You must create this data table to be able to graph the break-even point. a. In cell C13, create a formula using the number of units in column B and costs (fixed and variable) to calculate the total cost for producing that many units. For example, in C13, what is the total costs for producing one jacket? Important: Although cost is often thought of as a negative number in accounting, keep your calculations in positive numbers. x Copy and paste your formula into the remainder of column C. b. In cell D13, creste a formula using the number of units in column B and the sales price to caiculate the gross revenue for selling that many jackets. For example, in D13, what is the gross revenue for selling one jacket? Copy and paste your formula for the remainder of column D. 3. Graphi Solect the data table you have created in celis C12O42. Create a line graph for this data. Where the cost and gross revenue lines cross is the break-even point. Cheose The correct greph is graph C=x. 4. Uie your ipresdbet to explore how costs and yolume interect. What happens to the break-even point if you ralse the fixed costs? The break even point wa What babens to the breation point if you increase your sales price? The harkevesonint with 4, Use your spreadsheet to explore how costs and volume interact. What happens to the break-even point if you raise the fixed costs? The break-even point will What happens to the break-even point if you increase your sales price? The bresk-even point wilt What happens to the break-even point if you raise the variable costs? The break-even point witl 5. Caiculate profits in column E. For example, in E13, what is the profit for producing one jacket? Use a minus sign to enter loss, if any. 6. Using the graph, explain how a break-even point changes in relation to cost and sell price. Cost-Volume-Profit: Break-Even Analysis Using Excel Completing this activity will help you learn to: 1. understand how costs and sales price interact to produce profit. 2. create a reusable spreadsheet. 3. create absolute Excel references that will not change when a formula is copied and pasted. 4. create a graph to visually see a break-even point. Case scenario: You are working for a jacket manufacturer. You are interested in how many jackets need to be produced and sold to ma a profit. Two types of costs are relevant for production: 1. The fixed costs that your business will incur no matter the number of units produced, such as the manufacturing plant's rent expense and building security costs. 2. Variable costs that are incurred for each jacket produced, e.9. wool material. Assume that all produced jackets are sold. Sales price, variable cost, and fixed cost data are avallable within the Case Data Excel Spreadsheet. Create Excel calculations to determine the "break-even point," Then graph the units, profits, and cost to "see" the breakeven point. Required: You are to build a spreadsheet that can calculate break-even point. Break-even point is the number of units that a business has to sell negate costs and begin producing a profit. The calculations will update when you change the costs (fixed or variable) or sales price. Hint: The break-even point cannot be calculated with one Excel function. Through this case you will learn how to accomplish a complex task by breaking the problem into smaller steps. This case will guide you through the steps. HINT: STEP-BY-STEP WALKTHROUGH To help you get started, the file already has jacket sales, cost data, and column tities for you to fill out. Complete the following steps: 1. Excel Formula Section: Perform the following calculations using the given data. a. In cell C7, calculate the contribution margin per jacket unit. b. In cell C8, calculate the break-even point in facket units. 2. Data Table Section: Perform the following calculations using the given data. Hint: You need to use absolute references. Note: You must create this data table to be able to graph the break-even point. a. In cell C13, create a formula using the number of units in column B and costs (fixed and variable) to calculate the total cost for producing that many units. For example, in C13, what is the total costs for producing one jacket? Important: Although cost is often thought of as a negative number in accounting, keep your calculations in positive numbers. x Copy and paste your formula into the remainder of column C. b. In cell D13, creste a formula using the number of units in column B and the sales price to caiculate the gross revenue for selling that many jackets. For example, in D13, what is the gross revenue for selling one jacket? Copy and paste your formula for the remainder of column D. 3. Graphi Solect the data table you have created in celis C12O42. Create a line graph for this data. Where the cost and gross revenue lines cross is the break-even point. Cheose The correct greph is graph C=x. 4. Uie your ipresdbet to explore how costs and yolume interect. What happens to the break-even point if you ralse the fixed costs? The break even point wa What babens to the breation point if you increase your sales price? The harkevesonint with 4, Use your spreadsheet to explore how costs and volume interact. What happens to the break-even point if you raise the fixed costs? The break-even point will What happens to the break-even point if you increase your sales price? The bresk-even point wilt What happens to the break-even point if you raise the variable costs? The break-even point witl 5. Caiculate profits in column E. For example, in E13, what is the profit for producing one jacket? Use a minus sign to enter loss, if any. 6. Using the graph, explain how a break-even point changes in relation to cost and sell price