

Answered step by step
Verified Expert Solution
Question
1 Approved Answer
could analysis this graphvariations within each seed type. In [ 2 4 ] : , # 4 . Calculation: Compactness distribution across Assortment Categories plt
could analysis this graphvariations within each seed type.
In : # Calculation: Compactness distribution across Assortment Categories
pltfigurefigsize
snsboxplotseeds 'class', 'compactness'
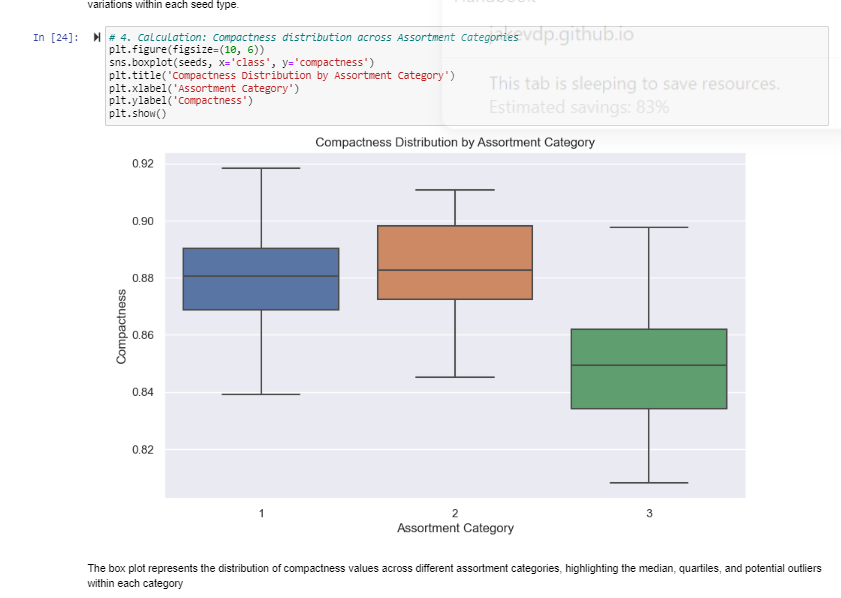
plttitleCompactness Distribution by Assortment Category"
pltxlabel Assortment Category'
pltylabel Compactness
pltshow
This tab is sleeping to save resources.
Estimated savings:
The box plot represents the distribution of compactness values across different assortment categories, highlighting the median, quartiles, and potential outliers
within each category
Step by Step Solution
There are 3 Steps involved in it
Step: 1

Get Instant Access to Expert-Tailored Solutions
See step-by-step solutions with expert insights and AI powered tools for academic success
Step: 2

Step: 3
Ace Your Homework with AI
Get the answers you need in no time with our AI-driven, step-by-step assistance
Get Started
Focus On Geodatabases In ArcGIS Pro
Authors: David W. Allen
1st Edition
1589484452, 978-1589484450