Answered step by step
Verified Expert Solution
Link Copied!

Question

1 Approved Answer

could i get help with how to do part c please? thank you 40 Number of homes sold 38 36 20 4 7 =300 Selling

could i get help with how to do part c please? thank you
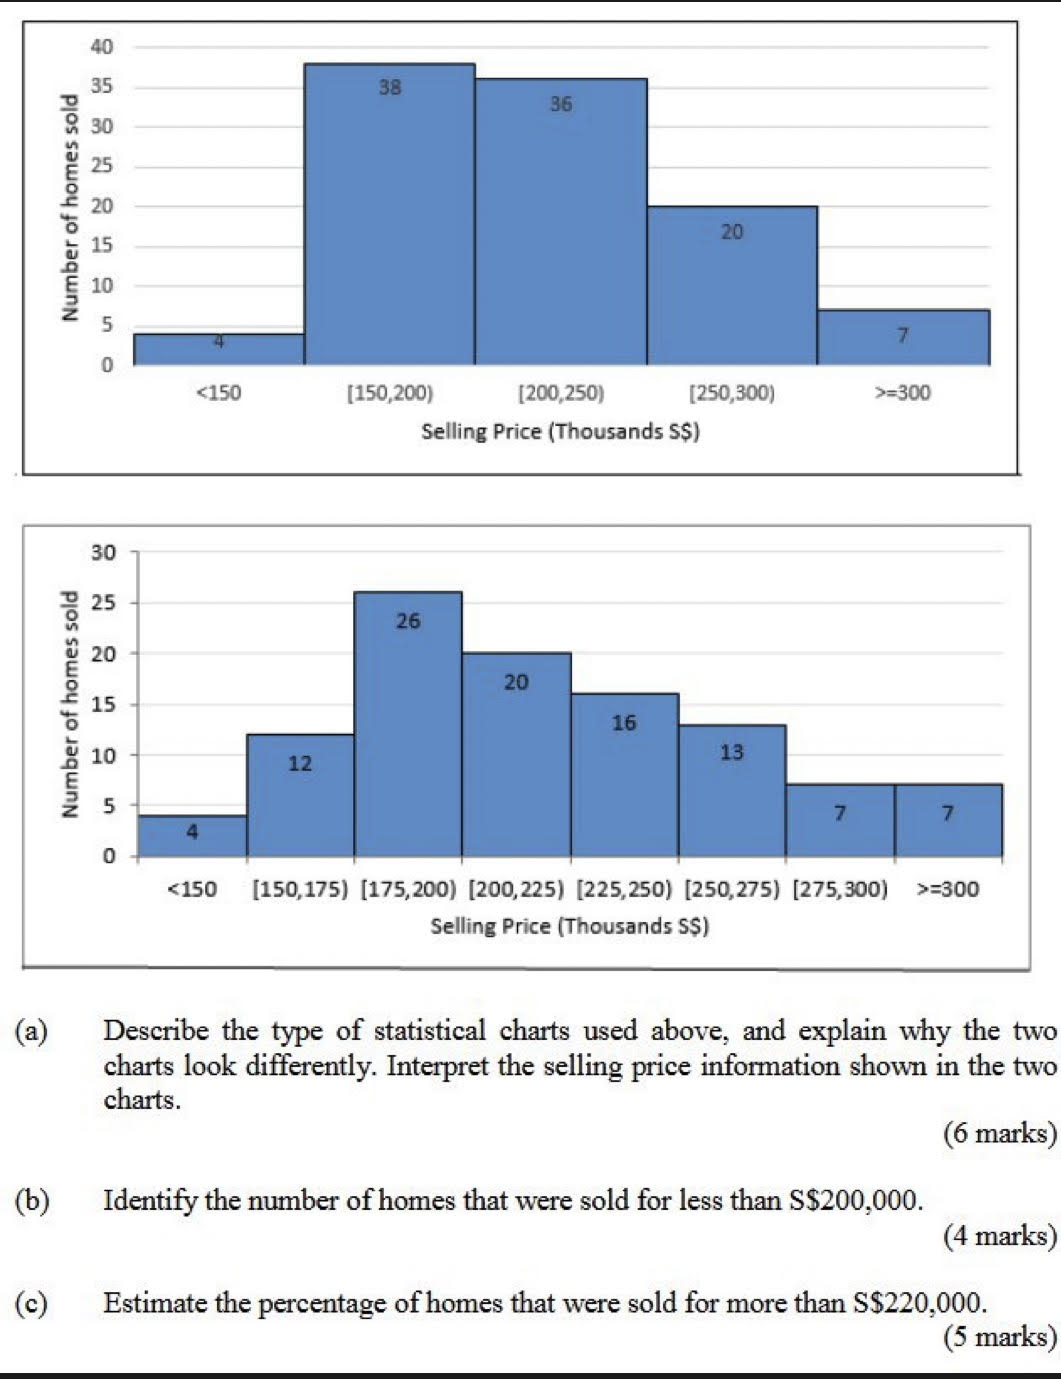
image text in transcribed
40 Number of homes sold 38 36 20 4 7 =300 Selling Price (Thousands S$) 30 Number of homes sold 25 26 20 20 15 16 10 12 13 7 4 7 O =300 Selling Price (Thousands S$) (a) Describe the type of statistical charts used above, and explain why the two charts look differently. Interpret the selling price information shown in the two charts. (6 marks) ( b ) Identify the number of homes that were sold for less than S$200,000. (4 marks) (c) Estimate the percentage of homes that were sold for more than S$220,000.

Step by Step Solution

There are 3 Steps involved in it

Step: 1

blur-text-image

Get Instant Access to Expert-Tailored Solutions

See step-by-step solutions with expert insights and AI powered tools for academic success

Step: 2

blur-text-image

Step: 3

blur-text-image

Ace Your Homework with AI

Get the answers you need in no time with our AI-driven, step-by-step assistance

Get Started

Recommended Textbook for

Mathematics for Economics and Business

Authors: Ian Jacques

9th edition

129219166X, 9781292191706 , 978-1292191669

More Books

Students also viewed these Mathematics questions

Question

Why have 3PLs become more important in recent years?

Answered: 1 week ago

Question

To solve p + 3q = 5z + tan( y - 3x)

Answered: 1 week ago