

Answered step by step
Verified Expert Solution
Question
1 Approved Answer
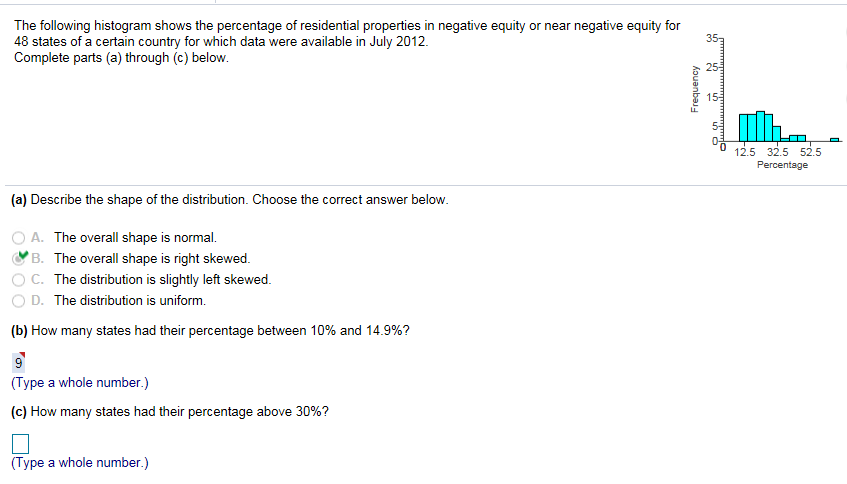
Could someone help with the last two questions? (See attached photo) The following histogram shows the percentage of residential properties in negative equity or near
Could someone help with the last two questions? (See attached photo)
Step by Step Solution
There are 3 Steps involved in it
Step: 1

Get Instant Access to Expert-Tailored Solutions
See step-by-step solutions with expert insights and AI powered tools for academic success
Step: 2

Step: 3
Ace Your Homework with AI
Get the answers you need in no time with our AI-driven, step-by-step assistance
Get Started
Mathematical Applications for the Management Life and Social Sciences
Authors: Ronald J. Harshbarger, James J. Reynolds
11th edition
9781337032247, 9781305465183, 1305108043, 1337032247, 1305465180, 978-1305108042