

Question: could you do this in an excel file Annual demand figures for Rocker Cellphone Company are as shown in Table 1. Estimate demand for the
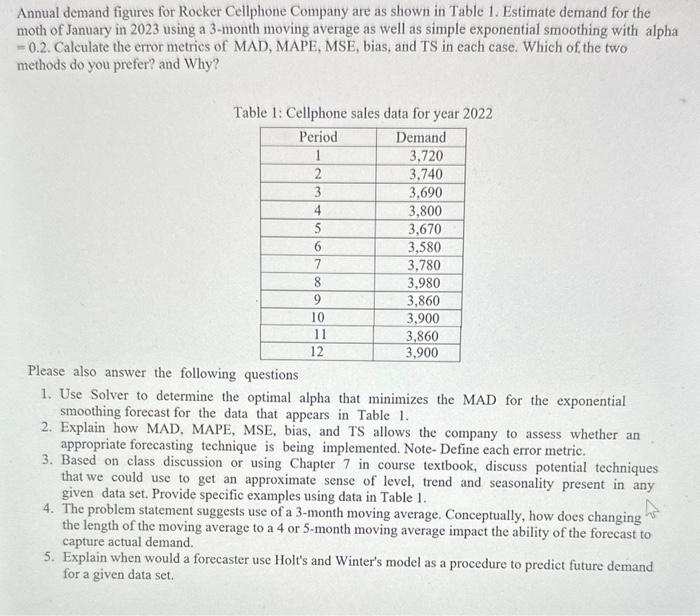
Annual demand figures for Rocker Cellphone Company are as shown in Table 1. Estimate demand for the moth of January in 2023 using a 3-month moving average as well as simple exponential smoothing with alpha =0.2. Calculate the error metrics of MAD, MAPE, MSE, bias, and TS in each case. Which of the two methods do you prefer? and Why? Table 1: Cellphone sales data for year 2022 Please also answer the following questions 1. Use Solver to determine the optimal alpha that minimizes the MAD for the exponential smoothing forecast for the data that appears in Table 1 . 2. Explain how MAD, MAPE, MSE, bias, and TS allows the company to assess whether an appropriate forecasting technique is being implemented. Note- Define each error metric. 3. Based on class discussion or using Chapter 7 in course textbook, discuss potential techniques that we could use to get an approximate sense of level, trend and seasonality present in any given data set. Provide specific examples using data in Table 1. 4. The problem statement suggests use of a 3-month moving average. Conceptually, how does changing the length of the moving average to a 4 or 5 -month moving average impact the ability of the forecast to capture actual demand. 5. Explain when would a forecaster use Holt's and Winter's model as a procedure to predict future demand for a given data set. Annual demand figures for Rocker Cellphone Company are as shown in Table 1. Estimate demand for the moth of January in 2023 using a 3-month moving average as well as simple exponential smoothing with alpha =0.2. Calculate the error metrics of MAD, MAPE, MSE, bias, and TS in each case. Which of the two methods do you prefer? and Why? Table 1: Cellphone sales data for year 2022 Please also answer the following questions 1. Use Solver to determine the optimal alpha that minimizes the MAD for the exponential smoothing forecast for the data that appears in Table 1 . 2. Explain how MAD, MAPE, MSE, bias, and TS allows the company to assess whether an appropriate forecasting technique is being implemented. Note- Define each error metric. 3. Based on class discussion or using Chapter 7 in course textbook, discuss potential techniques that we could use to get an approximate sense of level, trend and seasonality present in any given data set. Provide specific examples using data in Table 1. 4. The problem statement suggests use of a 3-month moving average. Conceptually, how does changing the length of the moving average to a 4 or 5 -month moving average impact the ability of the forecast to capture actual demand. 5. Explain when would a forecaster use Holt's and Winter's model as a procedure to predict future demand for a given data set
Step by Step Solution
There are 3 Steps involved in it

Get step-by-step solutions from verified subject matter experts