Could you please check the photo
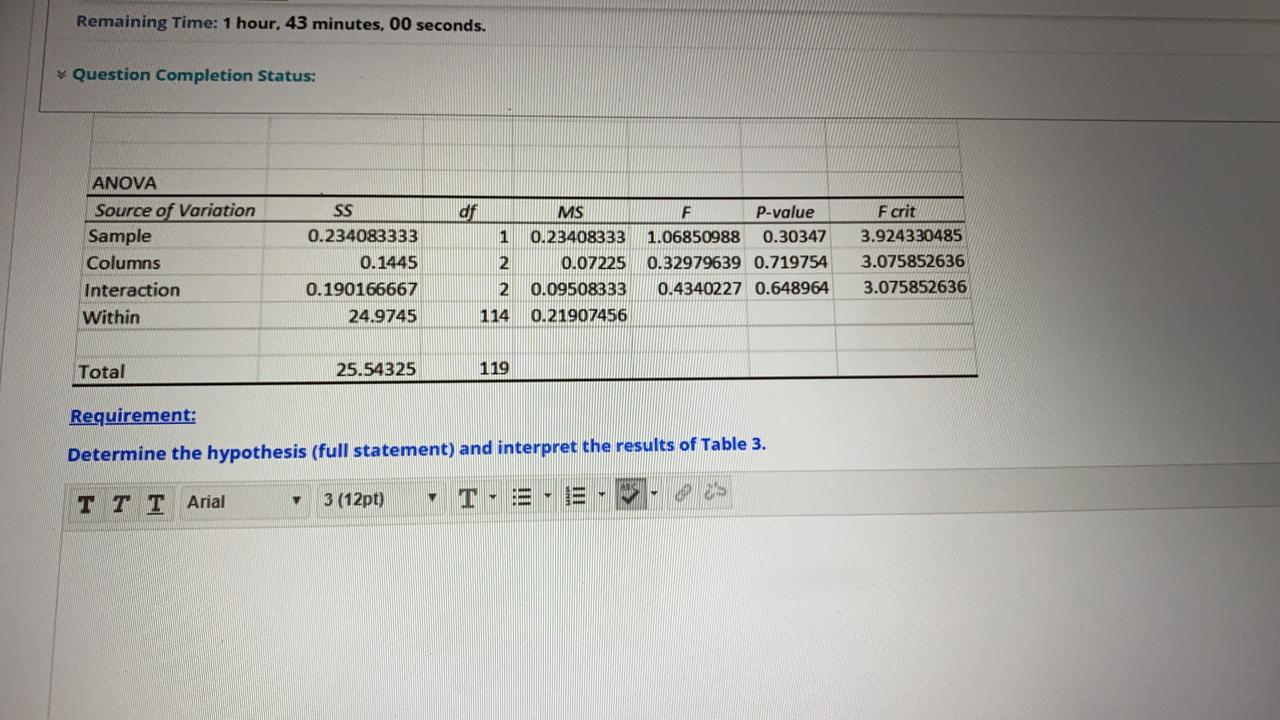
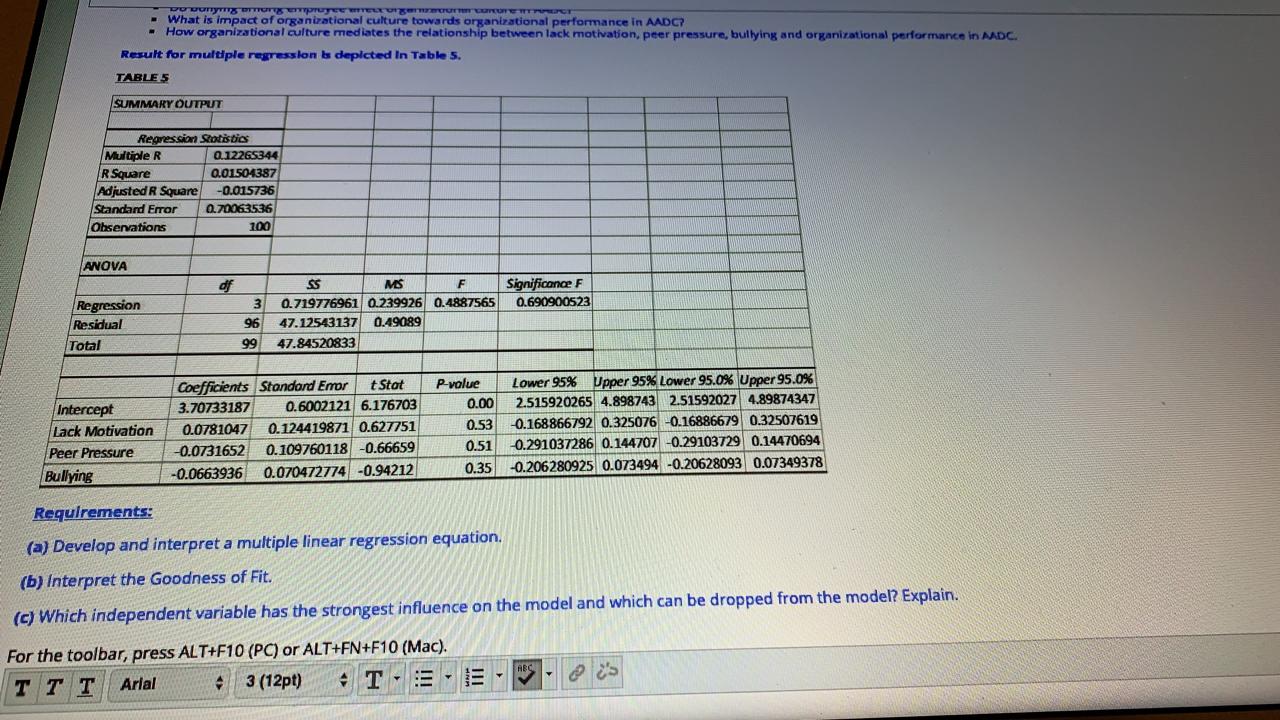
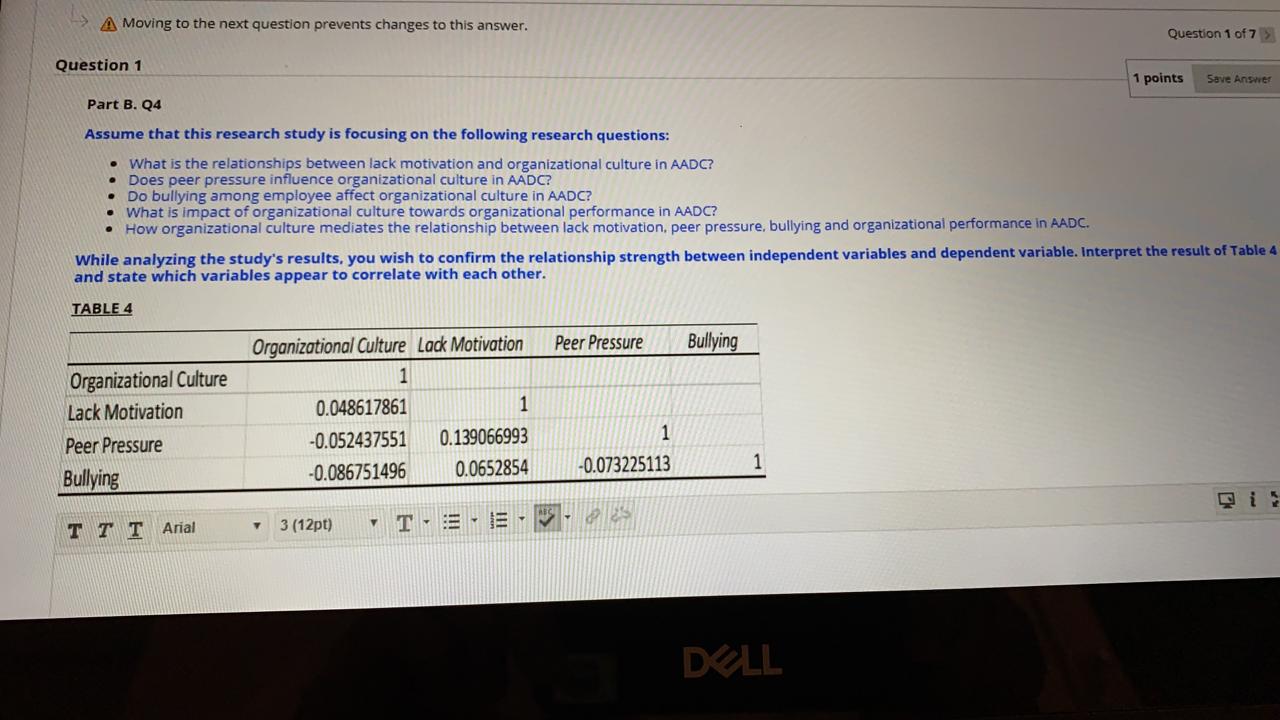
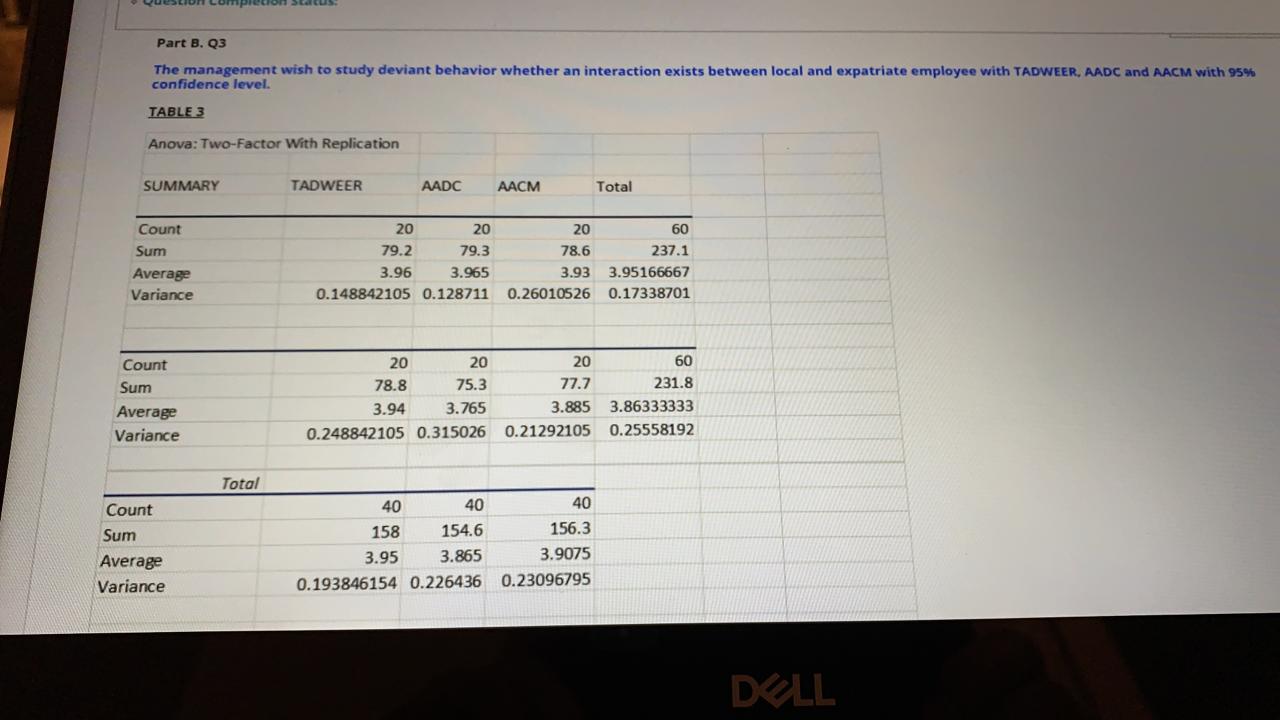
Remaining Time: 1 hour, 43 minutes, 00 seconds. * Question Completion Status: ANOVA Source of Variation SS of MS F P-value F crit Sample 0.234083333 1 0.23408333 1.06850988 0.30347 3.924330485 Columns 0.1445 2 0.07225 0.32979639 0.719754 3.075852636 Interaction 0.190166667 2 0.09508333 0.4340227 0.648964 3.075852636 Within 24.9745 114 0.21907456 Total 25.54325 119 Requirement: Determine the hypothesis (full statement) and interpret the results of Table 3. T T T Arial 3 (12pt) TEE- 3.What is impact of organizational culture towards organizational performance in AADC? How organizational culture mediates the relationship between lack motivation, peer pressure, bullying and organizational performance in AADC. Result for multiple regression is depicted In Table 5, TABLE 5 SUMMARY OUTPUT Regression Statistics Multiple R 0.12265344 R Square 0.01504387 Adjusted R Square -0.015736 Standard Error 0.70063536 Observations 100 ANOVA of MS F Significance F Regression 3 0.719776961 0.239926 0.4887565 0.690900523 Residual 96 47.12543137 0.49089 Total 99 47.84520833 Coefficients Standard Emor t Stat P-value Lower 95% Upper 95% Lower 95.0% Upper 95.0% Intercept 3.70733187 0.6002121 6.176703 0.00 2.515920265 4.898743 2.51592027 4.89874347 Lack Motivation 0.0781047 0.124419871 0.627751 0.53 0.168866792 0.325076 -0.16886679 0.32507619 Peer Pressure -0.0731652 0.109760118 -0.66659 0.51 -0.291037286 0.144707 -0.29103729 0.14470694 Bullying -0.0663936 0.070472774 -0.94212 0.35 -0.206280925 0.073494 -0.20628093 0.07349378 Requirements: (a) Develop and interpret a multiple linear regression equation. (b) Interpret the Goodness of Fit. (c) Which independent variable has the strongest influence on the model and which can be dropped from the model? Explain. For the toolbar, press ALT+F10 (PC) or ALT+FN+F10 (Mac). TTT Arial 3 (12pt) RECMoving to the next question prevents changes to this answer. Question 1 of 7 5 Question 1 1 points Part B. Q4 Save Answer Assume that this research study is focusing on the following research questions: What is the relationships between lack motivation and organizational culture in AADC? Does peer pressure influence organizational culture in AADC? Do bullying among employee affect organizational culture in AADC? What is impact of organizational culture towards organizational performance in AADC? How organizational culture mediates the relationship between lack motivation, peer pressure, bullying and organizational performance in AADC. While analyzing the study's results, you wish to confirm the relationship strength between independent variables and dependent variable. Interpret the result of Table 4 and state which variables appear to correlate with each other. TABLE 4 Organizational Culture Lack Motivation Peer Pressure Bullying Organizational Culture Lack Motivation 0.048617861 Peer Pressure -0.052437551 0.139066993 Bullying 0.086751496 0.0652854 -0.073225113 T T T Arial 3 (12pt) DELLPart B. Q3 confidence level. The management wish to study deviant behavior whether an interaction exists between local and expatriate employee with TADWEER, AADC and AACM with 95% TABLE 3 Anova: Two-Factor With Replication SUMMARY TADWEER AADC AACM Total Count 20 20 20 60 Sum 79.2 79.3 78.6 237.1 Average 3.96 3.965 3.93 3.95166667 Variance 0.148842105 0.128711 0.26010526 0.17338701 Count 20 20 20 60 Sum 78.8 75.3 77.7 231.8 Average 3.94 3.765 3.885 3.86333333 Variance 0.248842105 0.315026 0.21292105 0.25558192 Total Count 40 40 40 Sum 158 154.6 156.3 Average 3.95 3.865 3.9075 Variance 0.193846154 0.226436 0.23096795 DELL


