

Answered step by step
Verified Expert Solution
Question
1 Approved Answer
Could you please help me with this lab TA signature & TA initials on any changes made to the data are required or the data
Could you please help me with this lab 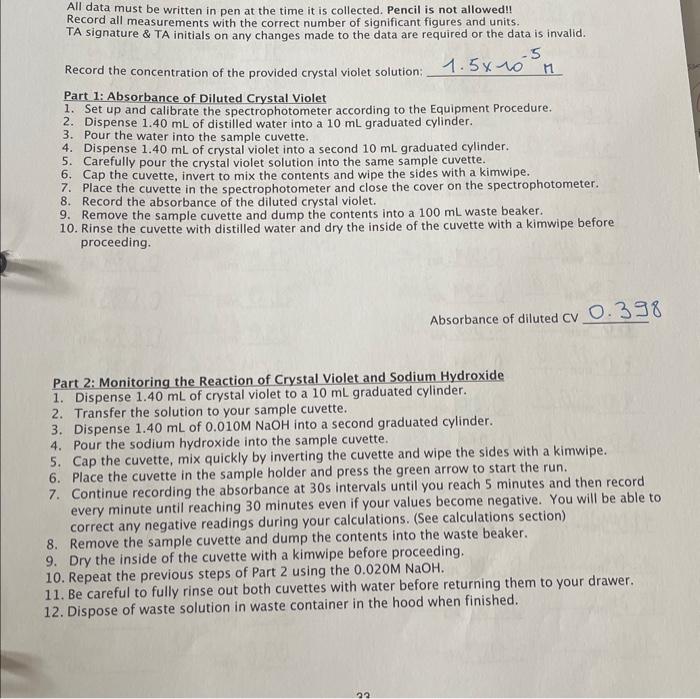
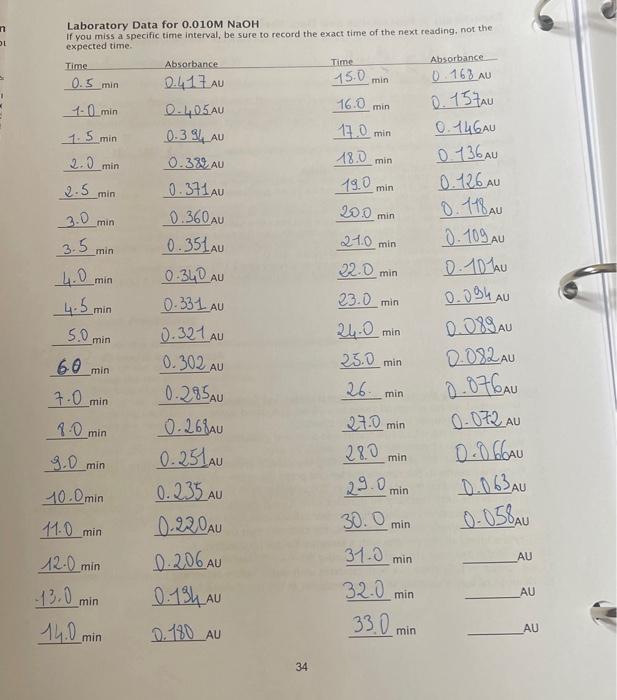
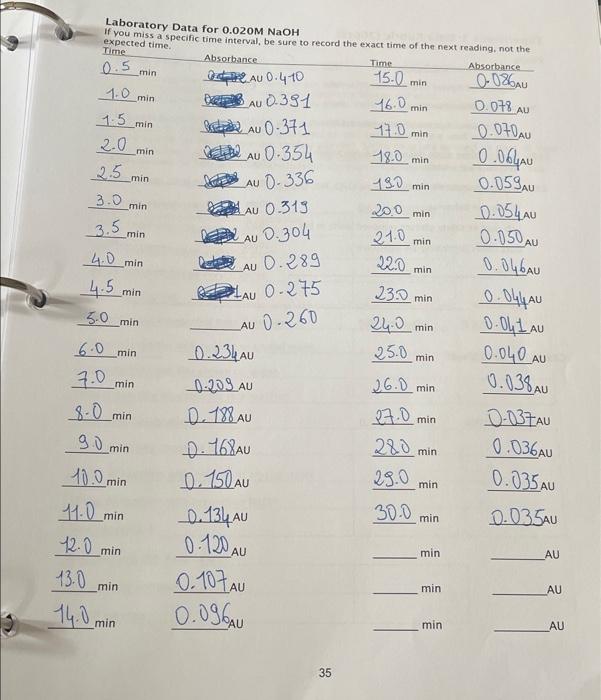
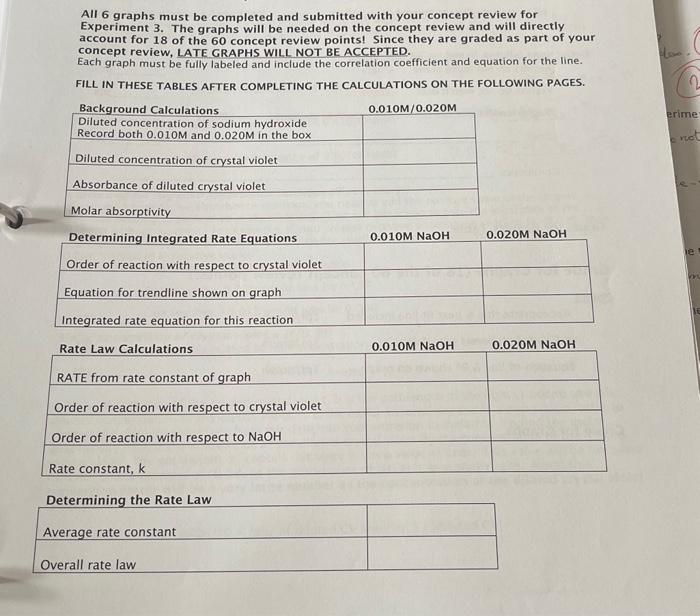
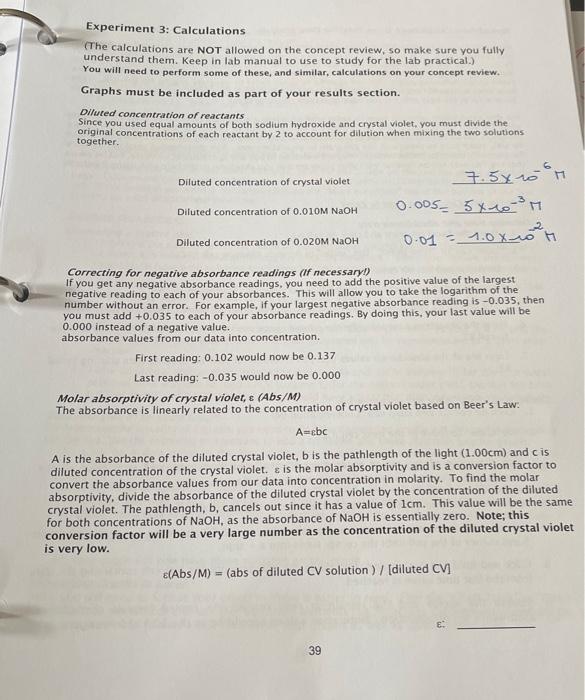
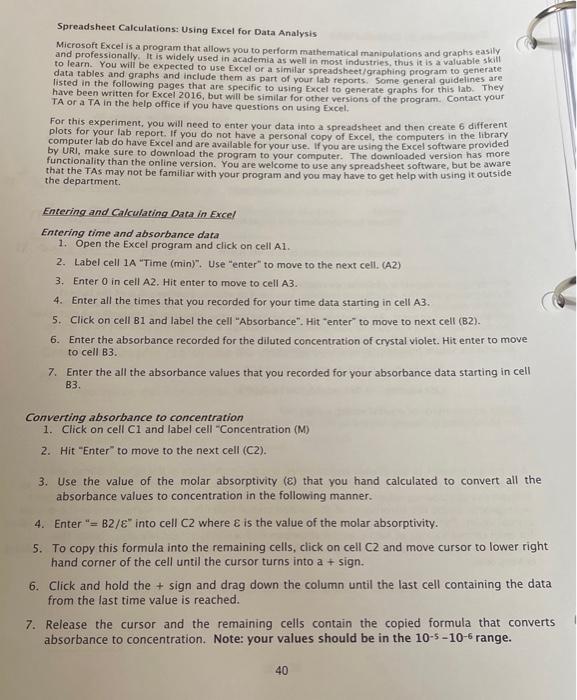
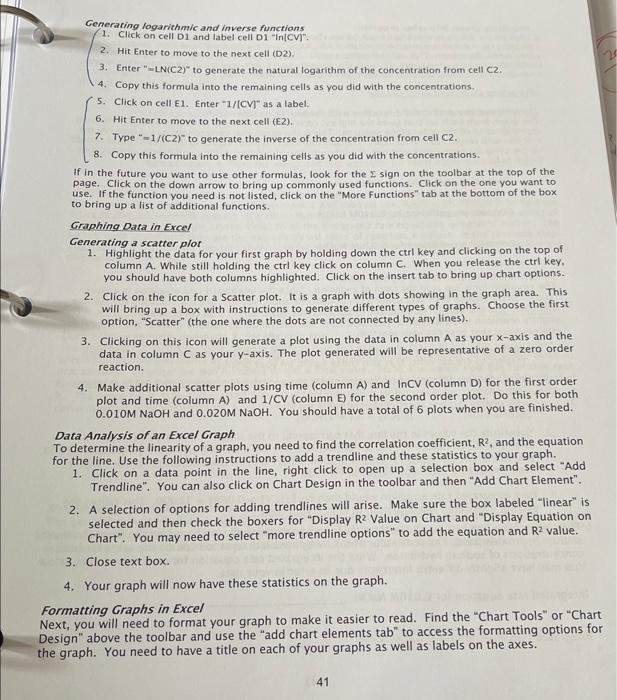
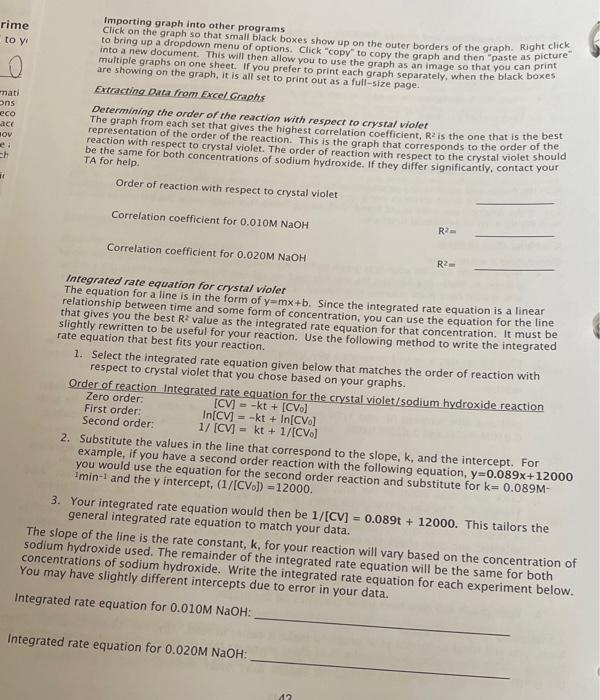
TA signature \& TA initials on any changes made to the data are required or the data is invalid. Record the concentration of the provided crystal violet solution: 1.5105 Part 1: Absorbance of Diluted Crystal Violet 1. Set up and calibrate the spectrophotometer according to the Equipment Procedure. 2. Dispense 1.40mL of distilled water into a 10mL graduated cylinder. 3. Pour the water into the sample cuvette. 4. Dispense 1.40mL of crystal violet into a second 10mL graduated cylinder. 5. Carefully pour the crystal violet solution into the same sample cuvette. 6. Cap the cuvette, invert to mix the contents and wipe the sides with a kimwipe. 7. Place the cuvette in the spectrophotometer and close the cover on the spectrophotometer. 8. Record the absorbance of the diluted crystal violet. 9. Remove the sample cuvette and dump the contents into a 100mL waste beaker. 10. Rinse the cuvette with distilled water and dry the inside of the cuvette with a kimwipe before proceeding. Part 2: Monitoring the Reaction of Crystal Violet and Sodium Hydroxide 1. Dispense 1.40mL of crystal violet to a 10mL graduated cylinder. 2. Transfer the solution to your sample cuvette. 3. Dispense 1.40mL of 0.010MNaOH into a second graduated cylinder. 4. Pour the sodium hydroxide into the sample cuvette. 5. Cap the cuvette, mix quickly by inverting the cuvette and wipe the sides with a kimwipe. 6. Place the cuvette in the sample holder and press the green arrow to start the run. 7. Continue recording the absorbance at 30 s intervals until you reach 5 minutes and then record every minute until reaching 30 minutes even if your values become negative. You will be able to correct any negative readings during your calculations. (See calculations section) 8. Remove the sample cuvette and dump the contents into the waste beaker. 9. Dry the inside of the cuvette with a kimwipe before proceeding. 10. Repeat the previous steps of Part 2 using the 0.020MNaOH. 11. Be careful to fully rinse out both cuvettes with water before returning them to your drawer. 12. Dispose of waste solution in waste container in the hood when finished. Laboratory Data for 0.010MNaOH Laboratory Data for 0.020MNaOH If you miss a specific time intensil ha....... All 6 graphs must be completed and submitted with your concept review for Experiment 3. The graphs will be needed on the concept review and will directly account for 18 of the 60 concept review points! Since they are graded as part of your concept review, LATE GRAPHS WILL NOT BE ACCEPTED. Each graph must be fully labeled and include the correlation coefficient and equation for the line. FILL IN THESE TABLES AFTER COMPLETING THE CALCULATIONS ON THE FOLLOWING PAGES. Experiment 3: Calculations (The calculations are NOT allowed on the concept review, so make sure you fully understand them. Keep in lab manual to use to study for the lab practical.) You will need to perform some of these, and similar, calculations on your concept review. Graphs must be included as part of your results section. Diluted concentration of reactants Since you used equal amounts of both sodium hydroxide and crystal violet, you must divide the original concentrations of each reactant by 2 to account for dilution when mixing the two solutions together. Correcting for negative absorbance readings (If necessary!) If you get any negative absorbance readings, you need to add the positive value of the largest. negative reading to each of your absorbances. This will allow you to take the logarithm of the number without an error. For example, if your largest negative absorbance reading is 0.035, then you must add +0.035 to each of your absorbance readings. By doing this, your last value will be 0.000 instead of a negative value. absorbance values from our data into concentration. First reading: 0.102 would now be 0.137 Last reading: 0.035 would now be 0.000 Molar absorptivity of crystal violet, (Abs/M) The absorbance is linearly related to the concentration of crystal violet based on Beer's Law: A=8bc A is the absorbance of the diluted crystal violet, b is the pathlength of the light (1.00cm) and c is diluted concentration of the crystal violet. is the molar absorptivity and is a conversion factor to convert the absorbance values from our data into concentration in molarity. To find the molar absorptivity, divide the absorbance of the diluted crystal violet by the concentration of the diluted crystal violet. The pathlength, b, cancels out since it has a value of 1cm. This value will be the same for both concentrations of NaOH, as the absorbance of NaOH is essentially zero. Note; this conversion factor will be a very large number as the concentration of the diluted crystal violet is very low. (Abs/M)=(absofdilutedCVsolution)/[dilutedCV] Spreadsheet Calculations: Using Excel for Data Analysis Microsoft Excel is a program that allows you to perform mathematical manipulations and graphs easily and professionally. It is widely used in academia as well in most industries, thus it is a valuable skill to learn. You will be expected to use Excel or a similar spreadsheet/graphing program to generate data tables and graphs and include them as part of your lab reports. Some general guidelines are listed in the following pages that are specific to using Excel to generate graphs for this lab. They have been written for Excel 2016, but will be similar for other versions of the program. Contact your TA or a TA in the help office if you have questions on using Excel. For this experiment, you will need to enter your data into a spreadsheet and then create 6 different. plots for your lab report. If you do not have a personal copy of Excel, the computers in the library computer lab do have Excel and are available for your use. If vou are using the Excel software provided by URI, make sure to download the program to your computer. The downioaded version has more functionality than the online version. You are welcome to use any spreadsheet software, but be aware that the TAs may not be familiar with your program and you may have to get help with using it outside the department. Entering and Galculating Data in Excel Entering time and absorbance data 1. Open the Excel program and click on cell A1. 2. Label cell 1A "Time (min)". Use "enter" to move to the next cell. (A2) 3. Enter 0 in cell A2. Hit enter to move to cell A3. 4. Enter all the times that you recorded for your time data starting in cell A3. 5. Click on cell B1 and label the cell "Absorbance". Hit "enter" to move to next cell (B2). 6. Enter the absorbance recorded for the diluted concentration of crystal violet. Hit enter to move to cell B3. 7. Enter the all the absorbance values that you recorded for your absorbance data starting in cell B3. Converting absorbance to concentration 1. Click on cell C1 and label cell - Concentration (M) 2. Hit "Enter" to move to the next cell (C2). 3. Use the value of the molar absorptivity (E) that you hand calculated to convert all the absorbance values to concentration in the following manner. 4. Enter "=B2/E" into cell C2 where is the value of the molar absorptivity. 5. To copy this formula into the remaining cells, click on cell C2 and move cursor to lower right hand corner of the cell until the cursor turns into a +sign. 6. Click and hold the + sign and drag down the column until the last cell containing the data from the last time value is reached. 7. Release the cursor and the remaining cells contain the copied formula that converts absorbance to concentration. Note: your values should be in the 105106 range. 40 Generating logarithmic and inverse functions 1. Click on cell D1 and label cell D1 "In[CV]". 2. Hit Enter to move to the next cell (D2). 3. Enter "= LN(C2) to generate the natural logarithm of the concentration from cell C2. 4. Copy this formula into the remaining cells as you did with the concentrations. 5. Click on cell E1. Enter "1/[CV]" as a label. 6. Hit Enter to move to the next cell (E2). 7. Type " =1/(C2)to generate the inverse of the concentration from cell C2. 8. Copy this formula into the remaining celis as you did with the concentrations. If in the future you want to use other formulas, look for the sign on the toolbar at the top of the page. Click on the down arrow to bring up commonly used functions. Click on the one you want to use. If the function you need is not listed, click on the "More Functions" tab at the bottom of the box to bring up a list of additional functions. Graphina Data in Excel Generating a scatter plot 1. Highlight the data for your first graph by holding down the ctrl key and clicking on the top of column A. While still holding the ctrl key click on column C. When you release the ctrl key. you should have both columns highlighted. Click on the insert tab to bring up chart options. 2. Click on the icon for a Scatter plot. It is a graph with dots showing in the graph area. This will bring up a box with instructions to generate different types of graphs. Choose the first option, "Scatter" (the one where the dots are not connected by any lines). 3. Clicking on this icon will generate a plot using the data in column A as your x-axis and the data in column C as your y-axis. The plot generated will be representative of a zero order reaction. 4. Make additional scatter plots using time (column A) and InCV (column D) for the first order plot and time (column A) and 1/CV (column E) for the second order plot. Do this for both 0.010MNaOH and 0.020MNaOH. You should have a total of 6 plots when you are finished. Data Analysis of an Excel Graph To determine the linearity of a graph, you need to find the correlation coefficient, R2, and the equation for the line. Use the following instructions to add a trendline and these statistics to your graph. 1. Click on a data point in the line, right click to open up a selection box and select "Add Trendline". You can also click on Chart Design in the toolbar and then "Add Chart Element". 2. A selection of options for adding trendlines will arise. Make sure the box labeled "linear" is selected and then check the boxers for "Display R2 Value on Chart and "Display Equation on Chart". You may need to select "more trendline options" to add the equation and R2 value. 3. Close text box. 4. Your graph will now have these statistics on the graph. Formatting Graphs in Excel Next, you will need to format your graph to make it easier to read. Find the "Chart Tools" or "Cha Design" above the toolbar and use the "add chart elements tab" to access the formatting options f the graph. You need to have a title on each of your graphs as well as labels on the axes. 41 Importing graph into other programs Click on the graph so that small black boxes show up on the outer borders of the graph. Right click to bring up a dropdown menu of options. Click "copy" to copy the graph and then "paste as picture" multiple graphs on one sheet. If then allow you to use the graph as an image so that you can print are showing on the graph, it is all set to print our as ach graph separately, when the black boxes Excacting Data from Excel Graphs. Determining the order of the reaction with respect to crystal violet The graph from each set that gives the highest correlation coefficient, R2 is the one that is the best reaction with respect to order of the reaction. This is the graph that corresponds to the order of the be the same for both concentrations of sodium of reaction with respect to the crystal violet should TA for help. Order of reaction with respect to crystal violet Correlation coefficient for 0.010MNaOH R2= Correlation coefficient for 0.020MNaOH Integrated rate equation for crystal violet The equation for a line is in the form of y=mx+b. Since the integrated rate equation is a linear relationship between time and some form of concentration, you can use the equation for the line that gives you the best R2 value as the integrated rate equation for that concentration. It must be rate equation that best fits your reaction. 1. Select the integrated rate equation given below that matches the order of reaction with respect to crystal violet that you chose based on your graphs. Order of reaction Integrated rate equation for the crystal violet/sodium hydroxide reaction 1/[CV]=kt+1/[CV0] would use the equation for the second or 3. Your integrated rate equation would then be 1/[CV]=0.089t+12000. This tailors the general integrated rate equation to match your data. e slope of the line is the rate constant, k, for your reaction will vary based on the concentration of lium hydroxide used. The remainder of the integrated rate equation will be the same for both centrations of sodium hydroxide. Write the integrated rate equation for each experiment below. may have slightly different intercepts due to error in your data. rated rate equation for 0.010MNaOH ated rate equation for 0.020MNaOH : Rate of reactions The slope of the integrated rate equation is the rate constant, k, for the crystal violet and is of sodium hydroxide of the reaction. You will have a different rate constant for each concentration reaction. This increase in the value of the rate in the sodium hydroxide increases the rate of the reaction and can be used as a substitution for "RATE" in, k, is directly proportional to the rate of the respect to the sodium hydroxide. Rate constant, k, from the integrated rate equation for the 0.010MNaOH Rate constant, k, from the integrated rate equation for the 0.020MNaOH Determining the order of the reaction with respect to sadium hydroxide Use the isolation method covered in experiment 1 and the rate law: RATE =k[CV]=[OH1n to find the reacter of the reaction with respect to sodium hydroxide. Remember, you already have the order of RATES used in the rate laws crystal violet from the integrated rate equations generated earlier. The The order of reaction with respect to two calculated rates of reaction, k values, in the previous step. correlation coefficient. Order of reaction for NaOH Determining the rate constant, k, for the rate law You now have all of the variables except k in the rate law above. Rearrange the rate law to solve for k using both concentrations of sodium hydroxide. The rate constants should be relatively close to one another. Average the two numbers to get a final value. Note: the value you get for this rate constant, k, IS NOT the same as the value from the integrated rate equation which is also labeled k. The value for k in the integrated rate equation assumes a given value for the sodium hydroxide concentration. The rate constant, k, in the rate law is independent of the sodium hydroxide equations. Rate constant for rate law Determining the overall rate law The general rate law is Rate =k[CV]m[OH]n. Fill in the orders of each reactant average rate constant found above into this equation. You now have an equation that allows you to monitor the rate of reaction for any combination of crystal violet and sodium hydroxide concentrations. Rate law Step by Step Solution
There are 3 Steps involved in it
Step: 1

Get Instant Access to Expert-Tailored Solutions
See step-by-step solutions with expert insights and AI powered tools for academic success
Step: 2

Step: 3
Ace Your Homework with AI
Get the answers you need in no time with our AI-driven, step-by-step assistance
Get Started