Could you please help to solve this question? Thank you very much!
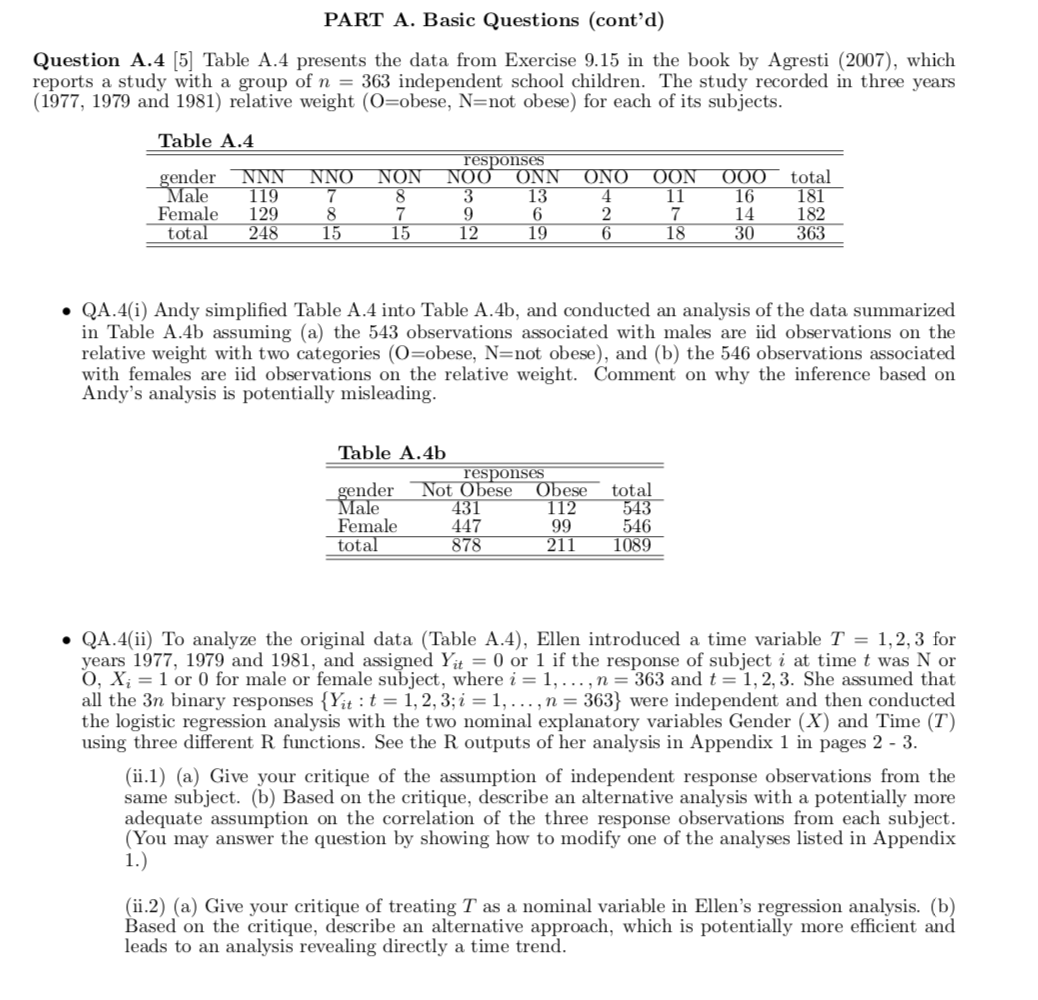
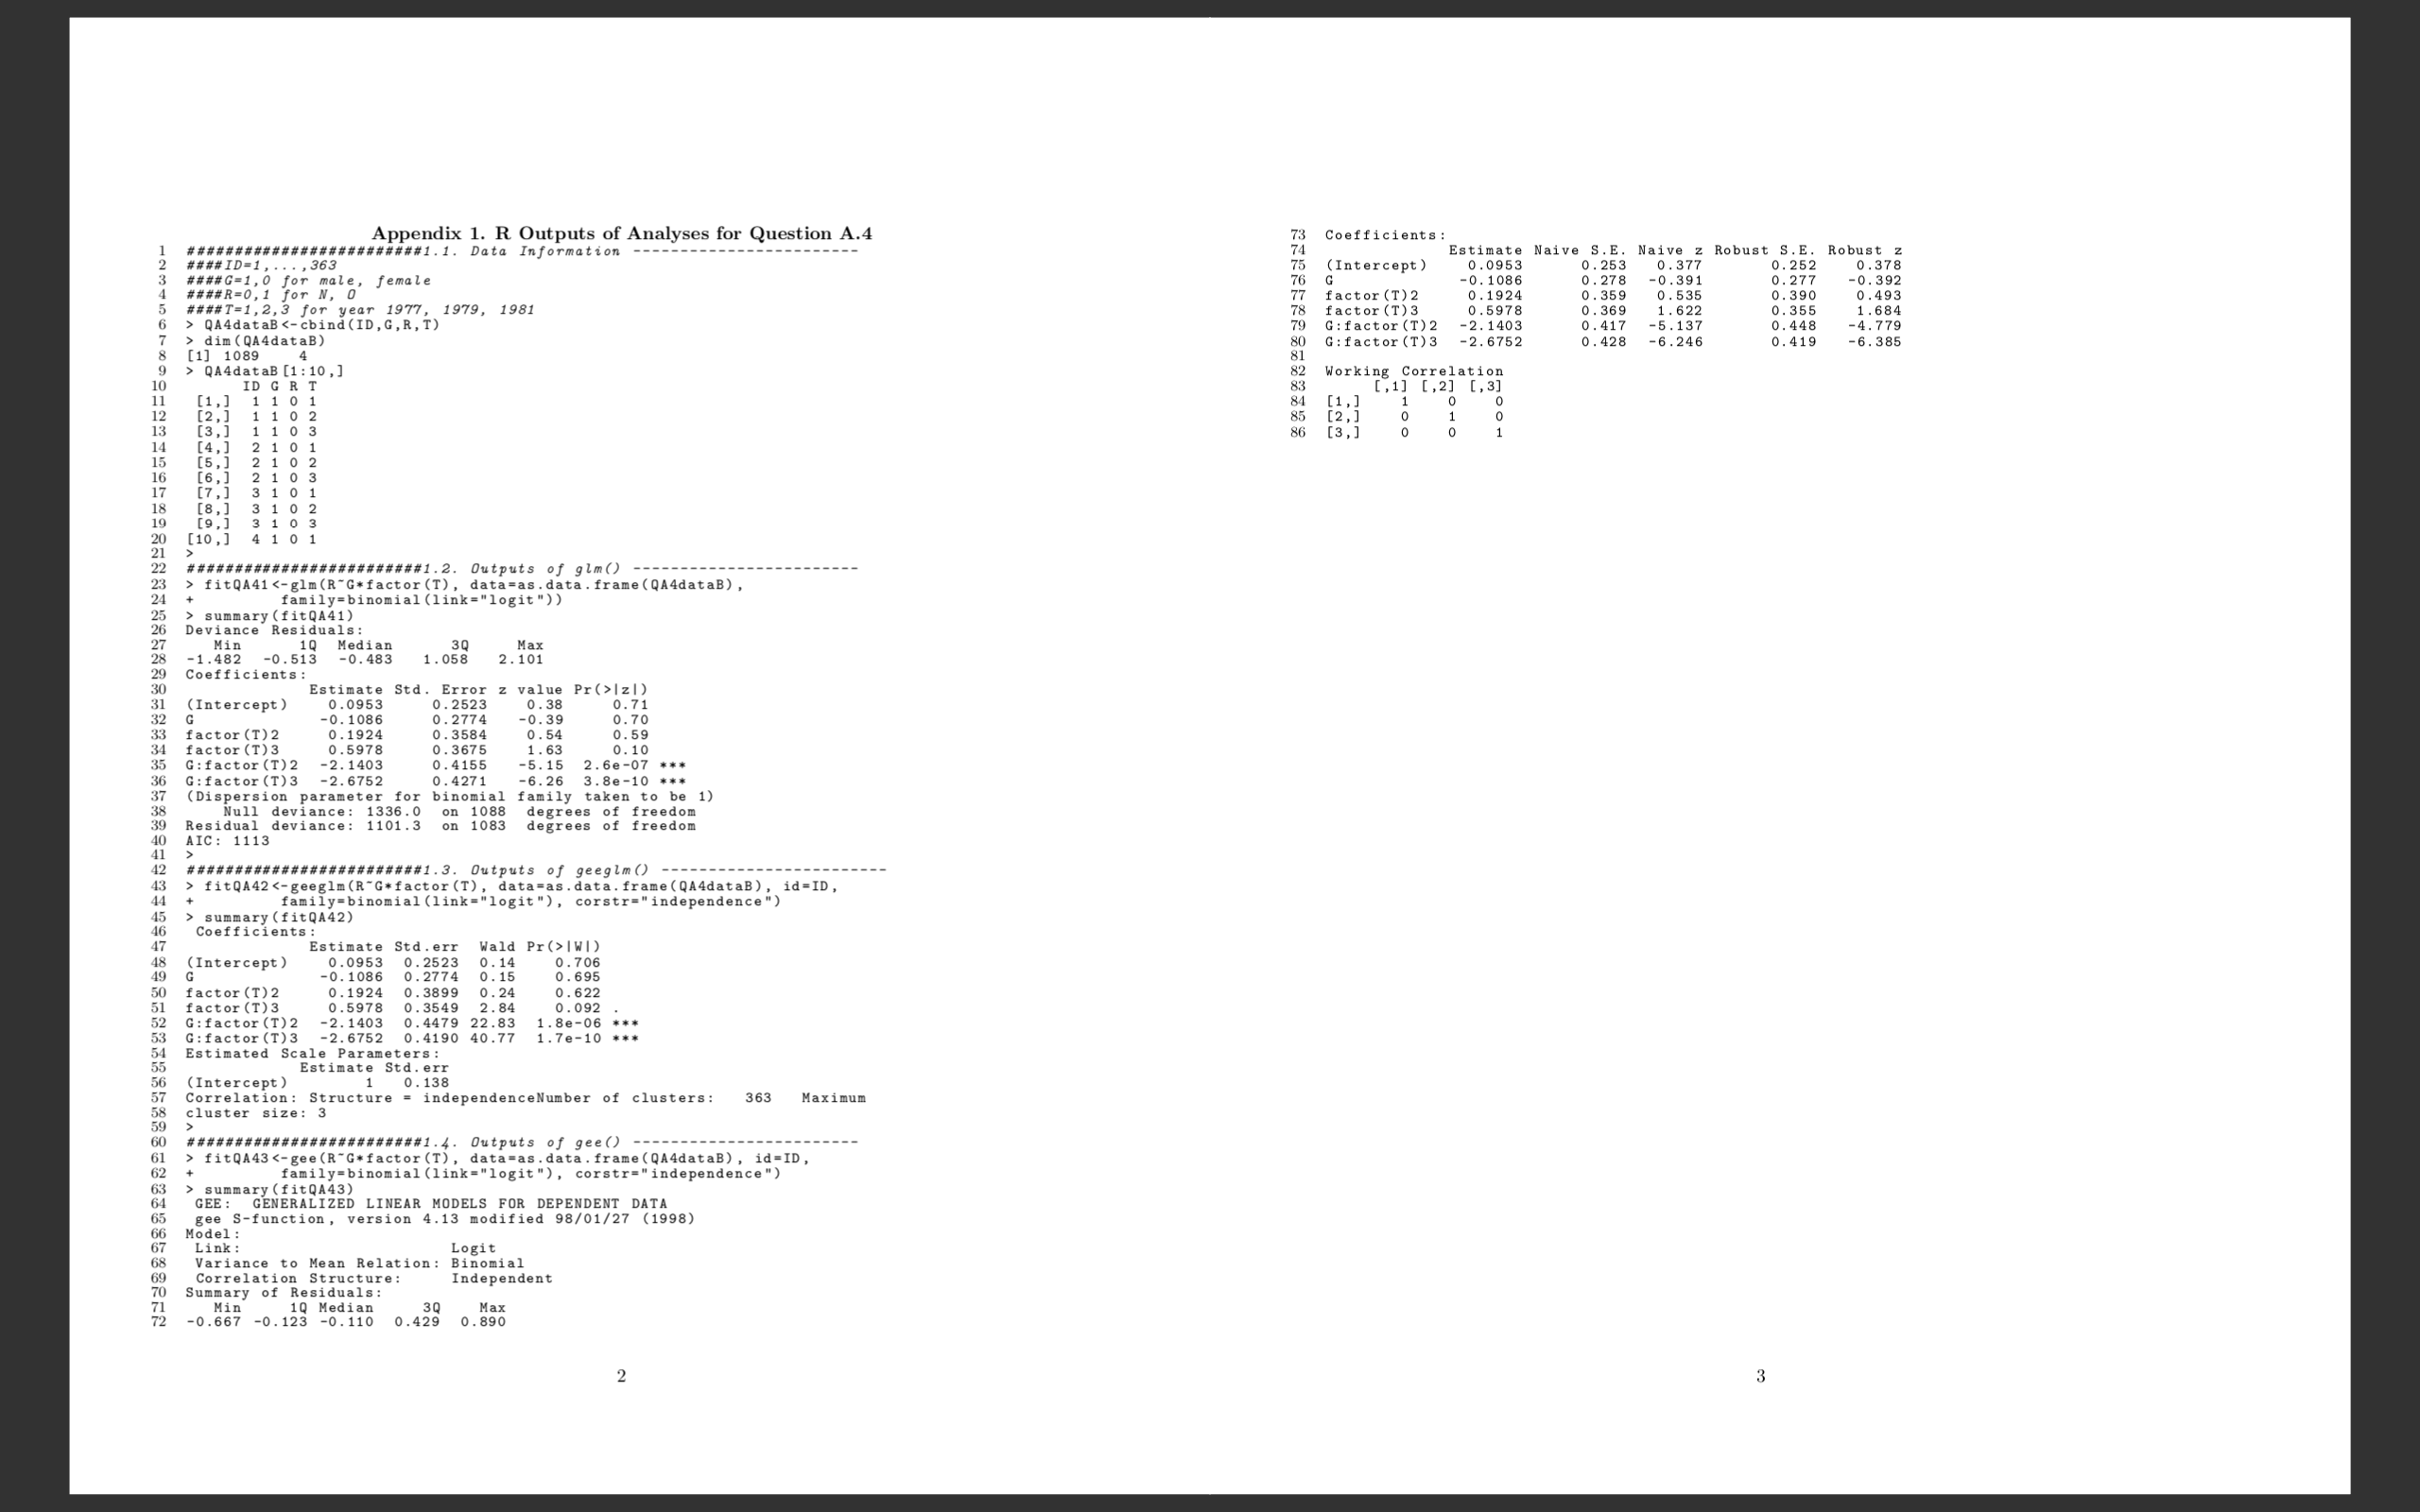
PART A. Basic Questions (cont'cl) Question A.4 [5] Table A.4 presents the data from Exercise 9.15 in the book by Agresti (21117), which reports a study with a group of n = 363 independent school children. The study recorded in three years (1977, 1979 and 1981) relative weight (0=obese, N=not obese) for each of its subjects. Table AA gender total Female 129 8 7 9 6 2 7 14 182 tot 248 15 15 12 19 6 18 30 363 o QA.4(i) Andy simplified Table A.4 into Table A.4b, and conducted an analysis of the data summarized in Table A.4b assuming (a) the 543 observations amociated with males are iid observations on the relative weight with two categories (0=obese, N=not obese), and (b) the 546 observations associated with females are iid observations on the relative weight. Comment on why the inference based on Andy's analysis is potentially misleading. Table A.4b res nses nder ot se ese total Female 447 99 546 total 878 211 1139 .- QA.4(ii) To analyse the original data (Table A.4), Ellen introduced a time variable T = 1,2,3 for years 1977, 1979 and 1981, and amigned Ya = 0 or 1 if the response of subject i at time t was N or 0, X; = 1 or 0 for male or female subject, where i = 1, . .. ,n = 363 and t = 1,2,3. She amumed that all the 37: binary responses {Ya : t = 1, 2, 3;i = 1, . . . ,n = 363} were independent and then conducted the logistic regression analysis with the two nominal explanatory variables Gender (X) and Time (T) using three different R functions. See the R outputs of her analysis in Appendix 1 in pages 2 - 3. (ii.1) (a) Give your critique of the amumption of independent response observations from the same subject. (b) Based on the critique, describe an alternative analysis with a potentially more adequate assumption on the correlation of the three response observations from each subject. (You may answer the question by showing how to modify one of the analyses listed in Appendix 1.) (ii.2) (a) Give your critique of treating T as a nominal variable in Ellen's regression analysis. (b) Based on the critique, describe an alternative approach, which is potentially more efcient and leads to an analysis revealing directly a time trend. Appendix 1. R Outputs of Analyses for Question A.4 # ## ################## ##1. 1. Data Information - - - -- ------- Coefficients : ID=1 , . . . . 363 timate . 0953 e Naive Nail Robust Rob Here for male , female (Intercept) .378 0. 1086 O N N OO CL ####T=1, 2,3 for year 1977, 1979, 1981 actor (T) 2 0. 1924 0 . 359 6 > QA4dataB dim (QA4dataB) G : factor (T) 2 2. 14 . 417 [1] 1089 G : factor (T) 3 6752 428 385 > QA4dataB [1 : 10, ] ID G R T Working Correlation 1101 [,2] 2, j 0 2 0 3 (4 , 1 2 1 10 1 15 , 2 1 0 2 2 1 0 3 [7,1 3 1 10 1 [8, j 3 1 0 2 310 [10 , ] 4 1 0 1 22 # ############## # ## # # # # ## #1. 2. Outputs of glm() ---- fitQA41 |z1) (Intercept ) 0. 0953 0. 2523 0 . 38 0. 71 -0. 1086 0. 2774 -0. 39 0 . 70 factor (T) 2 0. 1924 0.5978 0 3675 0 . 54 0. 59 factor (T) 3 G . factor (T) 2 -2.1403 0 4155 1. 63 0. 10 -5. 15 G : factor (T) 3 -2. 6752 2 . 6e-07 *** 0 . 4271 37 -6.26 3.8e-10 * Dispersion parameter 39 Null deviance: 1336.0 on 1088 family taken to be 1) degrees of freedom 40 Residual deviance: 1101.3 on 1083 degrees of freedom AIC : 1113 43 # ################ ## # # # # # #1. 3. Outputs of geeglm() - > fitQA42 summary (fitQA42) Coefficients : Estimate Std . err (Intercept ) 0. 0953 0. 2523 0.14 Wald Pr (> |WI) 0. 706 0. 1086 0. 2774 0. 15 0 . 695 50 factor (T) 2 01924 0 . 3899 2 84 0 . 622 52 factor (T ) 3 0 . 5978 0. 3549 0 . 092 G : factor (T) 2 -2. 1403 0. 4479 22.83 53 1. 8e-06 . G : factor (T) 3 -2. 6752 0. 4190 40.77 1.7e-10 * *. Estimated Scale Parameters : Estimate Std. err 57 (Intercept ) 0. 138 Correlation: Structure = independenceNumber of clusters: 363 Maximum cluster size: 3 88 8 # #######8############ ####1. 4. Outputs of gee() > fitQA43