could you please solve and compute the financial ratios for the Balance sheet and income statement 2017 and 2018
please compute:
liquidity ratios
Activity ratios
Leverage ratios
profitability ratios
Market ratios
Financial Ratio analysis
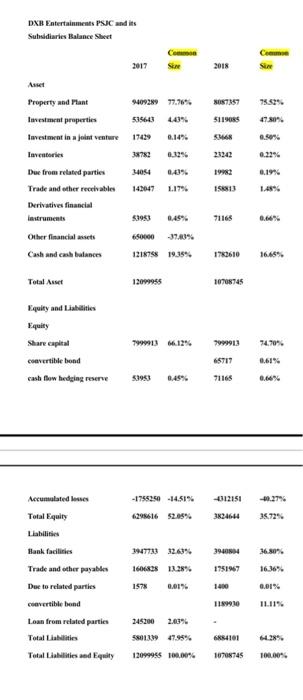
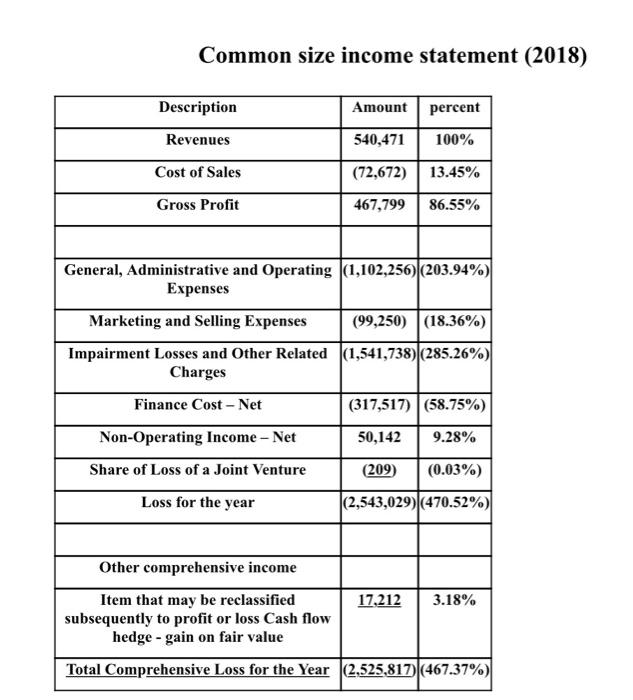
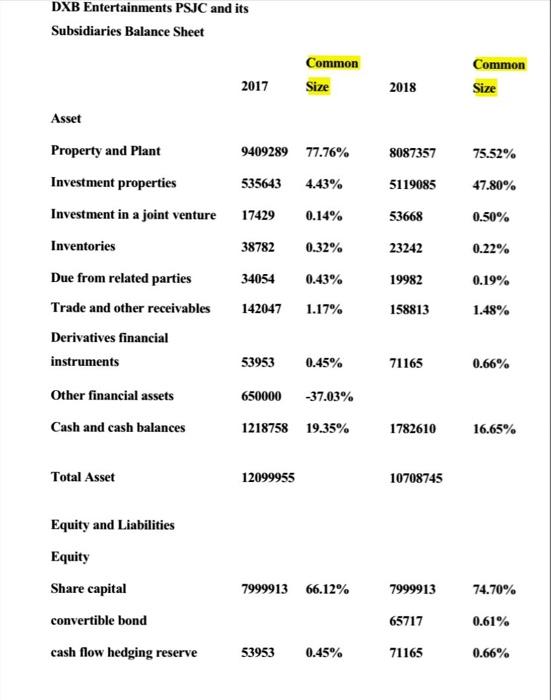
could you please compute the financial ratios for the below Balance sheet and income statement 2017 and 2018
please compute:
liquidity ratios
Activity ratios
Leverage ratios
profitability ratios
Market ratios
Financial Ratio analysis
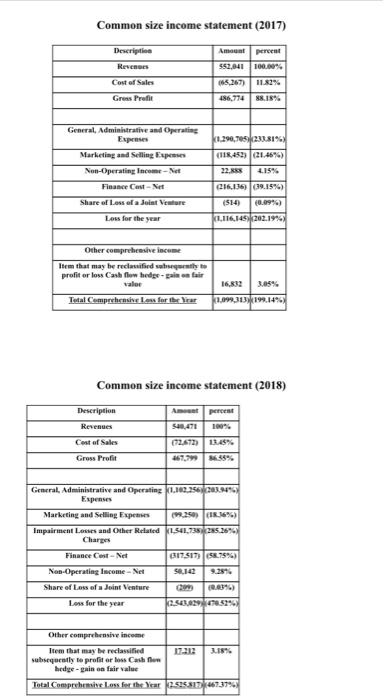
Common size income statement (2017)
Description | Amount | percent |
Revenues | 552,041 | 100.00% |
Cost of Sales | (65,267) | 11.82% |
Gross Profit | 486,774 | 88.18% |
| | |
General, Administrative and Operating Expenses | (1,290,705) | (233.81%) |
Marketing and Selling Expenses | (118,452) | (21.46%) |
Non-Operating Income Net | 22,888 | 4.15% |
Finance Cost Net | (216,136) | (39.15%) |
Share of Loss of a Joint Venture | (514) | (0.09%) |
Loss for the year | (1,116,145) | (202.19%) |
| | |
Other comprehensive income | | |
Item that may be reclassified subsequently to profit or loss Cash flow hedge - gain on fair value | 16,832 | 3.05% |
Total Comprehensive Loss for the Year | (1,099,313) | (199. |
Common size income statement (2017) Description Ament per 552,041 100.00% Revenge Cost of Sales Grens Profil 186,774 88.18% General Administrative and Operatin Express Marketing and selling up Non-Operating Income-Net 1.290, 75230.81% (118,452) (21.46%) 22.885 2.15% 216.136) (39.15%) (514) (0.09%) Finance Co-Net Share of Loss of a Joint Venture Lous for the year K1,116,1459202.1994 Other comprehensive income Item that may be reclassified saqarah: profit or loss Cashflow hedge-gain fair valor Total Comprehensive les for the Brar 16.833 1.099,313199.149 Common size income statement (2018) Am pre Description Revenues Cost of Sales (7262) 34% 469,799 85% Gross Profit General Administrative and Operating 1.100.356203.925 Expenses Marketing and selling Expenses (2250) (1.16%) Impairment Losses and Other Related KL 54.738285.26% Charges Finance Cest-Net 6175179158.75%) Non-Operating Income-Net S.142 Share of Loss of Joint Venture Loss for the year Other comprehensive income Item that may be reclassified 17212 2.18% subsequently to profit or loss Cashem hedge-gain on fair value Total Comprehensive Loss for the Year 2505817467.37% DXB Entertainments PSJC and its Subsidiaries Balance Sheet Cea Se Sie 2018 3087837 511985 . 23242 Property and Mant 9409289 77.76% Investment properties 4,43% lavestment in a joint venture 17429 Inventories Due from related parties 34054 Trade and other receivables 142047 1.17% Derivatives financial $1953 0.49% Other financial Cash and cash bulances 1218758 19.38% 71165 1763610 16.65% Total Asset 12009955 10708785 Equity and Liabilities Equity Share capital Convertible bond cash flow hedging reserve 79993 4.12% 7470 7999913 65717 0.61% 91168 0.66% Accumulated -1755250 -14.51% 4312151 Total Equity 629616 52.05% 3824644 35.725 3940 3947733 32.63% 1683 13.28% 1578 36.80 16.36% 175147 1400 0.01% Hank facilities Trade and other payable Due to related parties Convertible bond Loan from related parties Total Liabilities Total Lilities and Equity 1189930 245200 2.63% 12099946 100.00% 10708745 100.00 Common size income statement (2018) Description Amount percent Revenues 540,471 100% Cost of Sales (72,672) 13.45% Gross Profit 467,799 86.55% General, Administrative and Operating |(1,102,256) (203.94%) Expenses Marketing and Selling Expenses (99,250) (18.36%) Impairment Losses and Other Related |(1,541,738) (285.26%) Charges Finance Cost - Net (317,517) (58.75%) Non-Operating Income - Net 50,142 9.28% Share of Loss of a Joint Venture (209) (0.03%) Loss for the year |(2,543,029) (470.52%) Other comprehensive income Item that may be reclassified subsequently to profit or loss Cash flow hedge - gain on fair value 17,212 3.18% Total Comprehensive Loss for the Year (2.525,817) (467.37%) DXB Entertainments PSJC and its Subsidiaries Balance Sheet Common Size Common Size 2017 2018 Asset 940928977.76% 75.52% 535643 4.43% 8087357 5119085 53668 47.80% 17429 0.14% 0.50% 38782 Property and Plant Investment properties Investment in a joint venture Inventories Due from related parties Trade and other receivables Derivatives financial instruments 0.32% 23242 0.22% 34054 0.43% 19982 0.19% 142047 1.17% 158813 1.48% 53953 0.45% 71165 0.66% 650000 -37.03% Other financial assets Cash and cash balances 1218758 19.35% 1782610 16.65% Total Asset 12099955 10708745 Equity and Liabilities Equity Share capital convertible bond 7999913 66.12% 74.70% 7999913 65717 0.61% cash flow hedging reserve 53953 0.45% 71165 0.66% Common size income statement (2017) Description Ament per 552,041 100.00% Revenge Cost of Sales Grens Profil 186,774 88.18% General Administrative and Operatin Express Marketing and selling up Non-Operating Income-Net 1.290, 75230.81% (118,452) (21.46%) 22.885 2.15% 216.136) (39.15%) (514) (0.09%) Finance Co-Net Share of Loss of a Joint Venture Lous for the year K1,116,1459202.1994 Other comprehensive income Item that may be reclassified saqarah: profit or loss Cashflow hedge-gain fair valor Total Comprehensive les for the Brar 16.833 1.099,313199.149 Common size income statement (2018) Am pre Description Revenues Cost of Sales (7262) 34% 469,799 85% Gross Profit General Administrative and Operating 1.100.356203.925 Expenses Marketing and selling Expenses (2250) (1.16%) Impairment Losses and Other Related KL 54.738285.26% Charges Finance Cest-Net 6175179158.75%) Non-Operating Income-Net S.142 Share of Loss of Joint Venture Loss for the year Other comprehensive income Item that may be reclassified 17212 2.18% subsequently to profit or loss Cashem hedge-gain on fair value Total Comprehensive Loss for the Year 2505817467.37% DXB Entertainments PSJC and its Subsidiaries Balance Sheet Cea Se Sie 2018 3087837 511985 . 23242 Property and Mant 9409289 77.76% Investment properties 4,43% lavestment in a joint venture 17429 Inventories Due from related parties 34054 Trade and other receivables 142047 1.17% Derivatives financial $1953 0.49% Other financial Cash and cash bulances 1218758 19.38% 71165 1763610 16.65% Total Asset 12009955 10708785 Equity and Liabilities Equity Share capital Convertible bond cash flow hedging reserve 79993 4.12% 7470 7999913 65717 0.61% 91168 0.66% Accumulated -1755250 -14.51% 4312151 Total Equity 629616 52.05% 3824644 35.725 3940 3947733 32.63% 1683 13.28% 1578 36.80 16.36% 175147 1400 0.01% Hank facilities Trade and other payable Due to related parties Convertible bond Loan from related parties Total Liabilities Total Lilities and Equity 1189930 245200 2.63% 12099946 100.00% 10708745 100.00 Common size income statement (2018) Description Amount percent Revenues 540,471 100% Cost of Sales (72,672) 13.45% Gross Profit 467,799 86.55% General, Administrative and Operating |(1,102,256) (203.94%) Expenses Marketing and Selling Expenses (99,250) (18.36%) Impairment Losses and Other Related |(1,541,738) (285.26%) Charges Finance Cost - Net (317,517) (58.75%) Non-Operating Income - Net 50,142 9.28% Share of Loss of a Joint Venture (209) (0.03%) Loss for the year |(2,543,029) (470.52%) Other comprehensive income Item that may be reclassified subsequently to profit or loss Cash flow hedge - gain on fair value 17,212 3.18% Total Comprehensive Loss for the Year (2.525,817) (467.37%) DXB Entertainments PSJC and its Subsidiaries Balance Sheet Common Size Common Size 2017 2018 Asset 940928977.76% 75.52% 535643 4.43% 8087357 5119085 53668 47.80% 17429 0.14% 0.50% 38782 Property and Plant Investment properties Investment in a joint venture Inventories Due from related parties Trade and other receivables Derivatives financial instruments 0.32% 23242 0.22% 34054 0.43% 19982 0.19% 142047 1.17% 158813 1.48% 53953 0.45% 71165 0.66% 650000 -37.03% Other financial assets Cash and cash balances 1218758 19.35% 1782610 16.65% Total Asset 12099955 10708745 Equity and Liabilities Equity Share capital convertible bond 7999913 66.12% 74.70% 7999913 65717 0.61% cash flow hedging reserve 53953 0.45% 71165 0.66%