Question
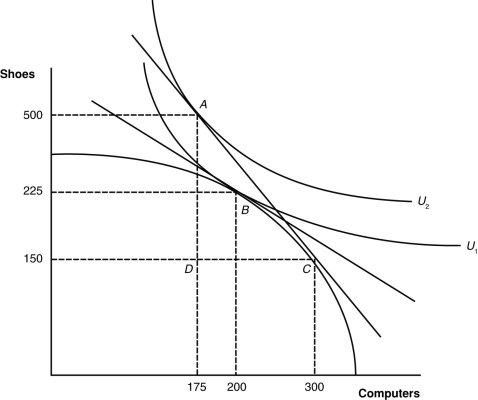
Country H Before and After Trade Equilibria Assume that shoes are a labor-intensive good, and computers are capital-intensive. When H trades, it is with country
Country H Before and After Trade Equilibria

Assume that shoes are a labor-intensive good, and computers are capital-intensive. When H trades, it is with country F. Use the graph above to answer the following.
- What was the pre-trade consumption/production of shoes and computers?
- Describe the trade flows between Countries H and F.
- What is the price ratio (Pc/Ps) at which free trade occurs?
- Compared to Country H, Country F is relatively _______ abundant and has a comparative advantage in producing _____.
- What happens to wages in Country H after trade? Briefly justify your answer.
3. | (5 points) Suppose that Home has 20% of the world's capital, 10% of the world's skilled labor, 30% of the world's unskilled labor, and produces 20% of the world's GDP. What does this information suggest about Home's resource endowments? Explain your answer. |
4. | (5 points) According to the Stolper-Samuelson theorem, would you expect U.S. skilled workers to benefit from free trade worldwide? Briefly explain your answer. |
5. | (5 points) According to the Stolper-Samuelson theorem, would you expect all workers across the globe to favor limiting trade? Why or why not? |
6. | (5 points) If Malaysia has a comparative advantage in producing low-skilled, labor-intensive goods, what should happen to Malaysian low-skilled workers' wages as trade barriers against Malaysian imports fall across the world? What should happen to returns to capital in Malaysia? Briefly explain why using what you’ve learned in lecture. |
- (30 points) Changing K/L ratios.
- (5 points) Draw an Edgeworth Box for country H where the production of X and Y utilize Capital (K) and Labor (L). Let X be the capital-intensive good, and Y be the labor intensive good. Sketch in an appropriate looking efficiency locus curve and identify two points along the curve, labeled A1 and A2, with A1 being the one closer to the origin for good X. You need not include isosquant curves.
- (5) Draw in lines representing K/L ratios for each industry at the points A1 and A2. This will be four lines total, label them kx,1, kx,2, ky,1, ky,2.
- (5) Suppose the economy starts at point A1. It then shifts production to A2. What change in world conditions could prompt such a change?
- (5) How have the K/L ratios changed in each industry?
- (10) Both industries X and Y have seen their K/L ratios change in the same direction. Yet, the overall K/L ratio is unchanged in the economy. Explain how this is possible.
Shoes 500 225 150 A Di 175 B 200 C 300 U Computers U.
Step by Step Solution
3.45 Rating (161 Votes )
There are 3 Steps involved in it
Step: 1
Real Interent Rate re Supply Demand ge off 8 1 Introduction A shoes are a work serious great and PCs ...
Get Instant Access to Expert-Tailored Solutions
See step-by-step solutions with expert insights and AI powered tools for academic success
Step: 2

Step: 3

Ace Your Homework with AI
Get the answers you need in no time with our AI-driven, step-by-step assistance
Get Started


