Country ry Male 2007 Male 2010 a) Find a regression model predicting the 2010 rate from the 2007 rate for the sample of 52 countries.
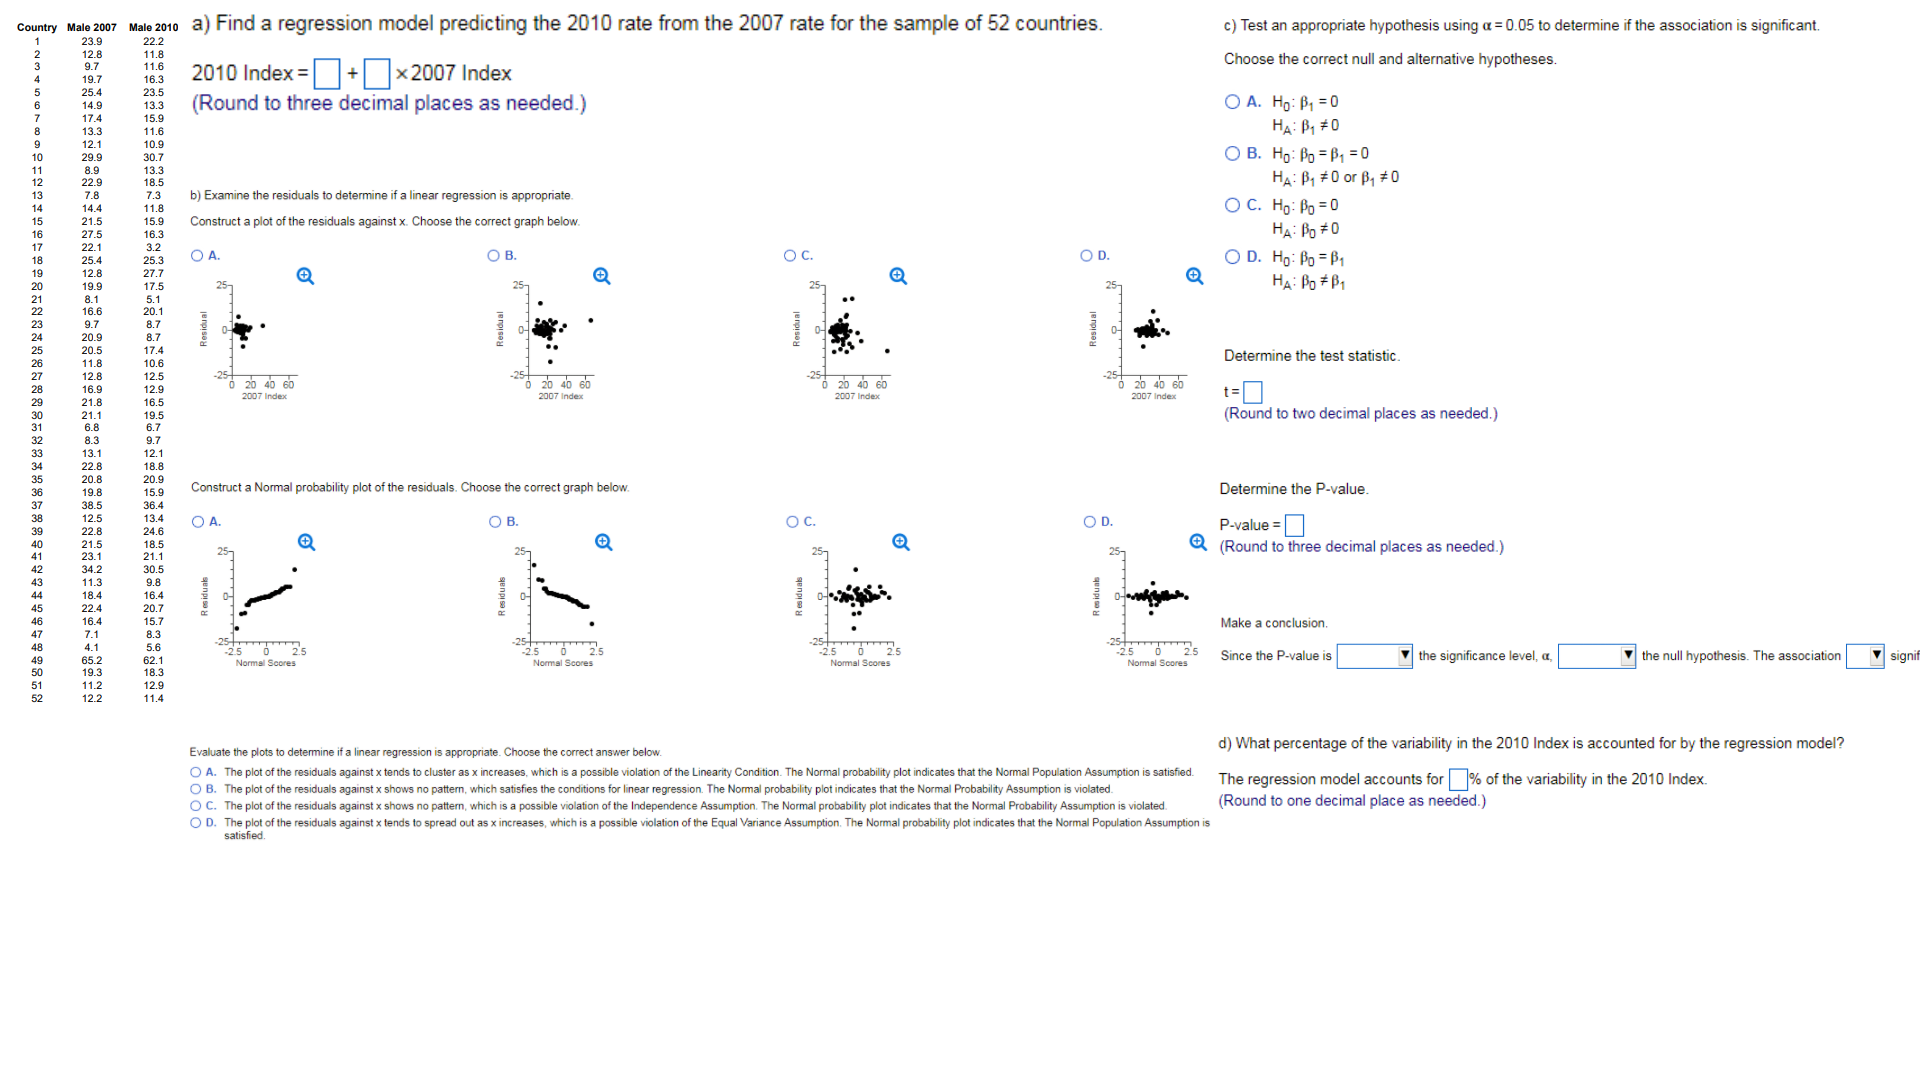
Country ry Male 2007 Male 2010 a) Find a regression model predicting the 2010 rate from the 2007 rate for the sample of 52 countries. c) Test an appropriate hypothesis using a = 0.05 to determine if the association is significant. 23.9 12.8 11.8 9.7 11.6 2010 Index =+x2007 Index Choose the correct null and alternative hypotheses. 19.7 16.3 25.4 23.5 14.9 13.3 (Round to three decimal places as needed.) O A. HO: B, = 0 17.4 15.9 13.3 11.6 HA: B, #0 12.1 109 29.9 30.7 O B. Ho: Bo = B1 = 0 8.9 13.3 22.9 18.5 HA: B, # 0 or B, #0 b) Examine the residuals to determine if a linear regression is appropriate. 14.4 11.8 O C. Ho: Bo = 0 21.5 15.9 Construct a plot of the residuals against x. Choose the correct graph below. 27.5 16.3 HA: PO # 0 22.1 3.2 25.4 25.3 O A. O B. O c. OD O D. Ho: Bo = B1 12.8 27.7 19.9 17.5 25- 25 HA: BO # B1 8.1 5.1 16. 20.1 8.7 Residual Residual Residual Residua 20.9 8.7 17.4 11.8 10.6 Determine the test statistic. 12.8 12.5 -25 25 25 16.9 12.9 20 40 60 20 40 60 20 40 60 0 20 40 60 21.8 2007 Index 2007 Index 2007 Index 2007 Index 16.5 21.1 19.5 (Round to two decimal places as needed.) 6.8 6.7 9.7 13.1 22.8 12.1 18.8 20.8 20.9 19.8 Construct a Normal probability plot of the residuals. Choose the correct graph below. Determine the P-value 38.5 36.4 12.5 13.4 24.6 O A. O B. 22.8 O C. O D. P-value = 18.5 21.1 257 25 (Round to three decimal places as needed.) 30.5 9 8 18.4 16.4 Residual Residual Residual Residual 20.7 CON 15.7 8.3 Make a conclusion. 4.1 5.6 25 75 0 25 65.2 62.1 25 "Normal Scores Normal Scores mal Score Since the P-value is the significance level, a, the null hypothesis. The association signi 19.3 18.3 11.2 12.9 12.2 11.4 Evaluate the plots to determine if a linear regression is appropriate. Choose the correct answer below. d) What percentage of the variability in the 2010 Index is accounted for by the regression model? O A. The plot of the residuals aga ncreases, which is a possible violation of the Linearity Condition. The Normal probability plot indicates that the Normal Population Assumption is satisfied. O B. The plot of the residuals again satisfies the conditions for linear regression. The Normal probability plot indicates that the Normal Probability Assumption is violated. The regression model accounts for % of the variability in the 2010 Index. O C. The plot of the residuals against x violation of the Independence Assumption. The Normal probability plot indicates that the Normal Probability Assumption is violated. (Round to one decimal place as needed. O D. The plot of the residuals against x tends to spread out as x increases, which is a possible violation of the Equal Variance Assumption. The Normal probability plot indicates that the Normal Population Assumption is satisfied
Step by Step Solution
There are 3 Steps involved in it
Step: 1
Get Instant Access to Expert-Tailored Solutions
See step-by-step solutions with expert insights and AI powered tools for academic success
Step: 2
Step: 3
Ace Your Homework with AI
Get the answers you need in no time with our AI-driven, step-by-step assistance