Question
Create a CASH Flow chart and NPW graph. Answer the following questions. The equipment will cost $730,000 and lasts the entire 12 year project.

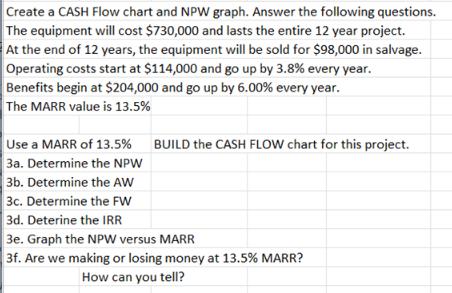
Create a CASH Flow chart and NPW graph. Answer the following questions. The equipment will cost $730,000 and lasts the entire 12 year project. At the end of 12 years, the equipment will be sold for $98,000 in salvage. Operating costs start at $114,000 and go up by 3.8% every year. Benefits begin at $204,000 and go up by 6.00% every year. The MARR value is 13.5% Use a MARR of 13.5% 3a. Determine the NPW 3b. Determine the AW 3c. Determine the FW BUILD the CASH FLOW chart for this project. 3d. Deterine the IRR 3e. Graph the NPW versus MARR 3f. Are we making or losing money at 13.5% MARR? How can you tell?
Step by Step Solution
3.43 Rating (153 Votes )
There are 3 Steps involved in it
Step: 1
To create a cash flow chart and analyze the project we first need to calculate the annual cash flows for each year of the project based on the given i...
Get Instant Access to Expert-Tailored Solutions
See step-by-step solutions with expert insights and AI powered tools for academic success
Step: 2

Step: 3

Ace Your Homework with AI
Get the answers you need in no time with our AI-driven, step-by-step assistance
Get StartedRecommended Textbook for
Fundamentals of Financial Management
Authors: Eugene F. Brigham, Joel F. Houston
12th edition
978-0324597714, 324597711, 324597703, 978-8131518571, 8131518574, 978-0324597707
Students also viewed these Accounting questions
Question
Answered: 1 week ago
Question
Answered: 1 week ago
Question
Answered: 1 week ago
Question
Answered: 1 week ago
Question
Answered: 1 week ago
Question
Answered: 1 week ago
Question
Answered: 1 week ago
Question
Answered: 1 week ago
Question
Answered: 1 week ago
Question
Answered: 1 week ago
Question
Answered: 1 week ago
Question
Answered: 1 week ago
Question
Answered: 1 week ago
Question
Answered: 1 week ago
Question
Answered: 1 week ago
Question
Answered: 1 week ago
Question
Answered: 1 week ago
Question
Answered: 1 week ago
Question
Answered: 1 week ago
Question
Answered: 1 week ago
Question
Answered: 1 week ago
Question
Answered: 1 week ago
View Answer in SolutionInn App


