

Answered step by step
Verified Expert Solution
Question
1 Approved Answer
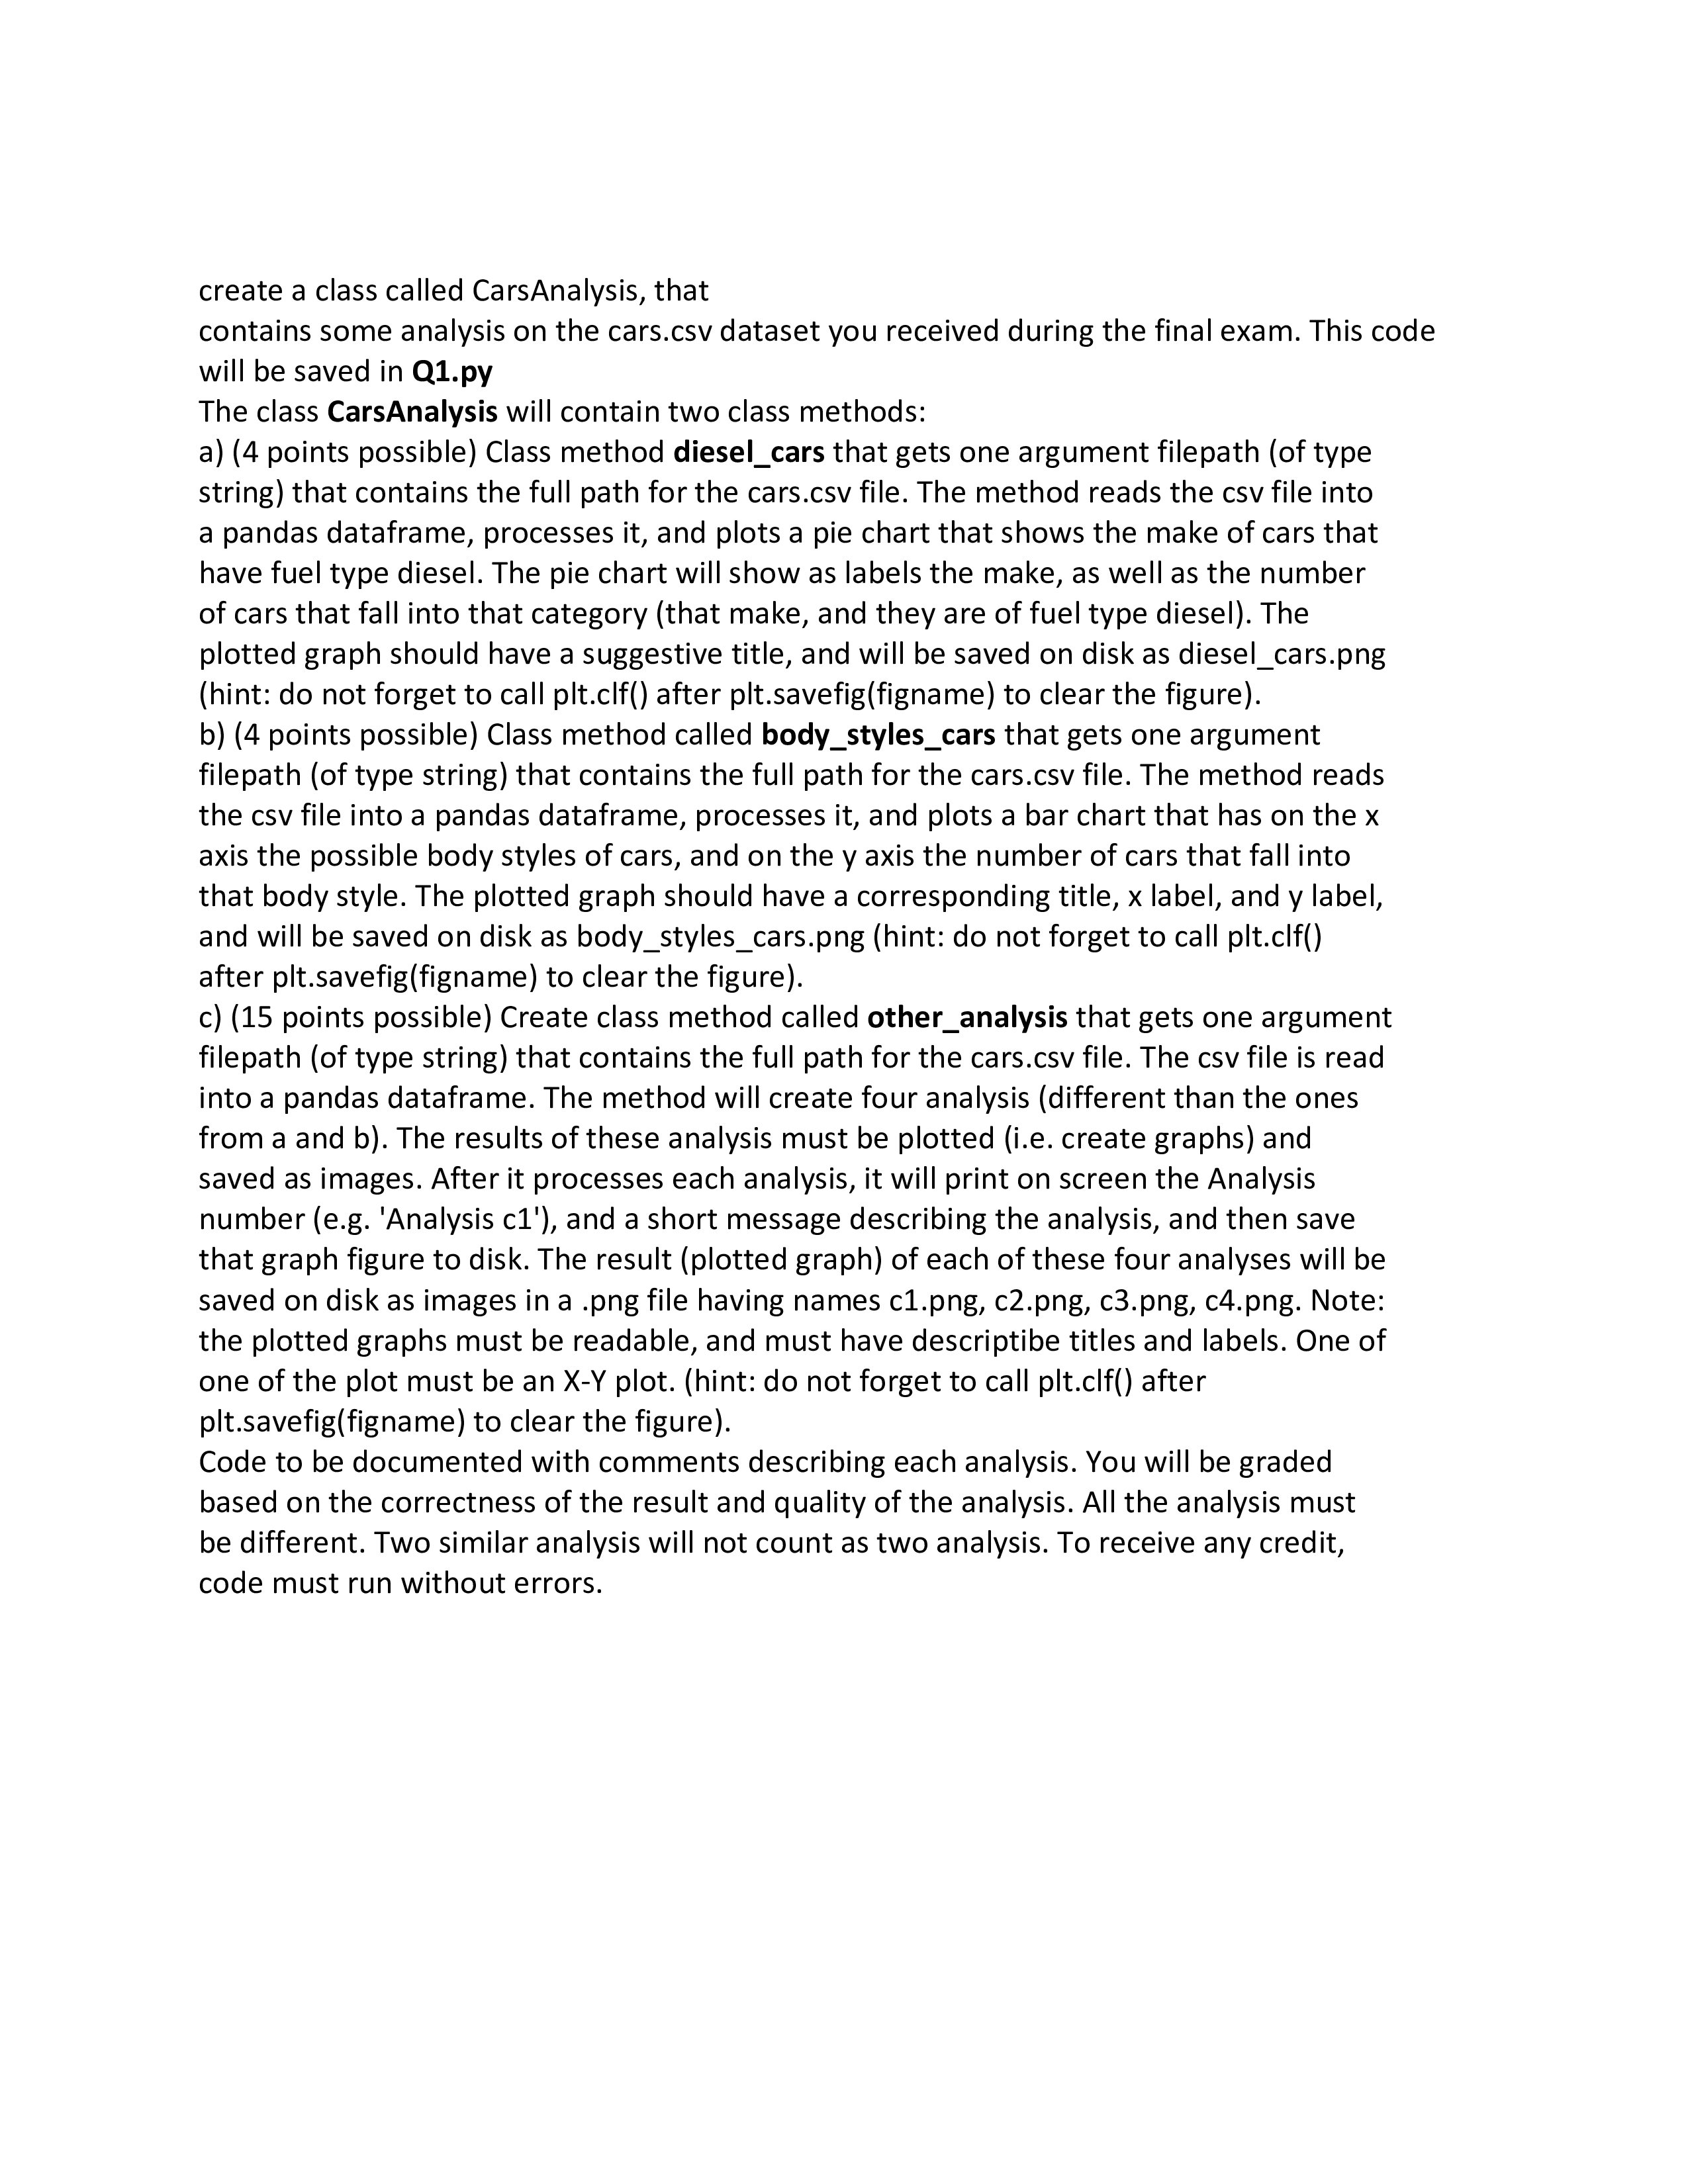
create a class called CarsAnalysis, that contains some analysis on the cars.csv dataset you received during the final exam. This code will be saved in
create a class called CarsAnalysis, that
contains some analysis on the cars.csv dataset you received during the final exam. This code
will be saved in
Qpy
The class CarsAnalysis will contain two class methods:
a points possible Class method dieselcars that gets one argument filepath of type
string that contains the full path for the cars.csv file. The method reads the csv file into
a pandas dataframe, processes it and plots a pie chart that shows the make of cars that
have fuel type diesel. The pie chart will show as labels the make, as well as the number
of cars that fall into that category that make, and they are of fuel type diesel The
plotted graph should have a suggestive title, and will be saved on disk as dieselcars.png
hint: do not forget to call pltclf after pltsavefigfigname to clear the figure
b points possible Class method called bodystylescars that gets one argument
filepath of type string that contains the full path for the cars.csv file. The method reads
the csv file into a pandas dataframe, processes it and plots a bar chart that has on the
axis the possible body styles of cars, and on the axis the number of cars that fall into
that body style. The plotted graph should have a corresponding title, label, and y label,
and will be saved on disk as bodystylescars.png hint: do not forget to call pltclf
after pltsavefigfigname to clear the figure
c points possible Create class method called otheranalysis that gets one argument
filepath of type string that contains the full path for the cars.csv file. The csv file is read
into a pandas dataframe. The method will create four analysis different than the ones
from a and The results of these analysis must be plotted ie create graphs and
saved as images. After it processes each analysis, it will print on screen the Analysis
number eg 'Analysis c and a short message describing the analysis, and then save
that graph figure to disk. The result plotted graph of each of these four analyses will be
saved on disk as images in a png file having names cpng cpng cpng cpng Note:
the plotted graphs must be readable, and must have descriptibe titles and labels. One of
one of the plot must be an XY plot. hint: do not forget to call pltclf after
pltsavefigfigname to clear the figure
Code to be documented with comments describing each analysis. You will be graded
based on the correctness of the result and quality of the analysis. All the analysis must
be different. Two similar analysis will not count as two analysis. To receive any credit,
code must run without errors.
Step by Step Solution
There are 3 Steps involved in it
Step: 1

Get Instant Access to Expert-Tailored Solutions
See step-by-step solutions with expert insights and AI powered tools for academic success
Step: 2

Step: 3
Ace Your Homework with AI
Get the answers you need in no time with our AI-driven, step-by-step assistance
Get Started
Optimizing Database Performance Techniques To Optimize The Efficiency Of Database Systems And Applications
Authors: Craig S Mullins
1st Edition
B0CFZFD49Y, 979-8857641286