Break down the scope identified from the SIPOC Diagram and choose potential causal steps that might cause the identified problem other info: the lead time
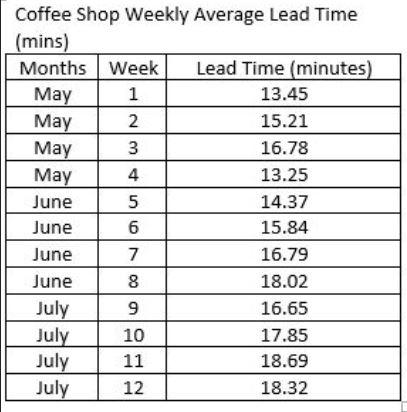
Break down the scope identified from the SIPOC Diagram and choose potential causal steps that might cause the identified problem other info: the lead time of serving the hot coffee at coffee shop more than 15 minutes. The staffing model of the shop has one cashier, one barista and a guard. The number of staff, equipment and raw materials has been found sufficient. Based on initial data analysis, the volume of customers has been stable
.
SIPOC DIAGRAM
Coffee Shop Weekly Average Lead Time (mins) Months Week May ay Lead Time (minutes) 1 13.45 2 15.21 May 16.78 May 4 13.25 June 14.37 June 6. 15.84 June 7 16.79 June 8 18.02 July July July July 9 16.65 10 17.85 11 18.69 12 18.32
Step by Step Solution
3.32 Rating (155 Votes )
There are 3 Steps involved in it
Step: 1
Answer One of my favorite continuous improvement tools is called a SIPOC diagram A SIPOC diagram is used by a team to identify all relevant elements o...
See step-by-step solutions with expert insights and AI powered tools for academic success
Step: 2

Step: 3

Ace Your Homework with AI
Get the answers you need in no time with our AI-driven, step-by-step assistance
Get Started


