

Answered step by step
Verified Expert Solution
Question
1 Approved Answer
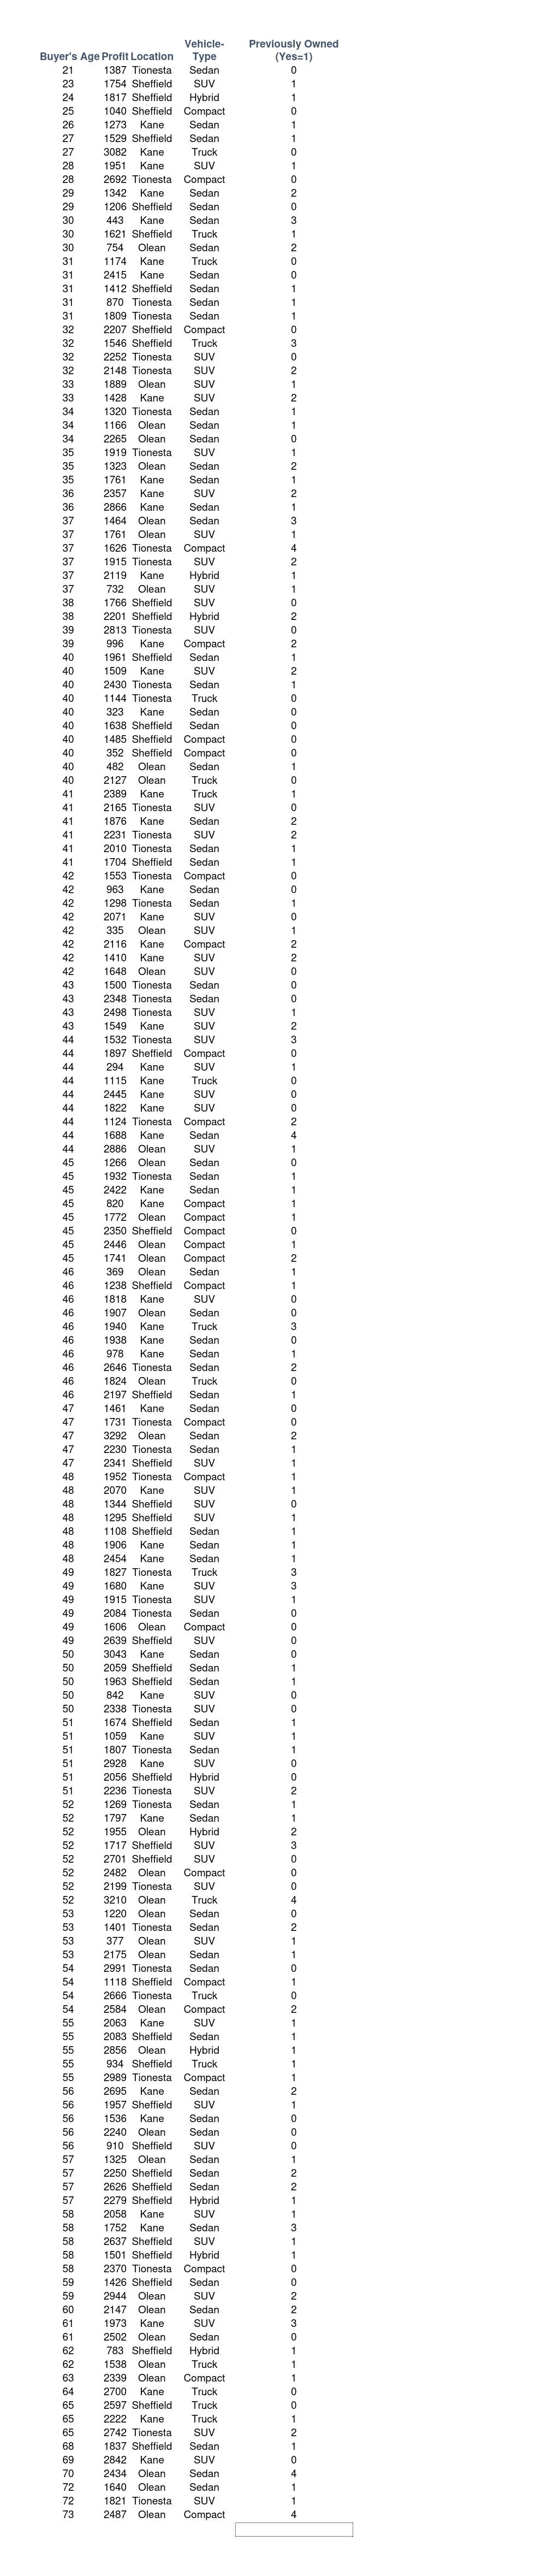
Create a frequency and relative frequency distribution for each quantitative variable. Create a histogram and a pie graph for each quantitative variable. Which class has
- Create a frequency and relative frequency distribution for each quantitative variable. Create a histogram and a pie graph for each quantitative variable. Which class has the largest frequency for each variable? Which class has the smallest frequency smallest frequency? Around which values does the data tend to cluster? To answer these questions, use the exercises shown in the online lecture. Specifically, perform these calculations by writing formulas in excel.
- Create a frequency polygon for the quantitative variables. What is the mean, median and mode for each quantitative variable? Is the data skewed? If so, is the skewness positive or negative? What is the skewness coefficient?
- What is the data minimum, maximum and median for your quantitative data? Create a boxplot to display those values. What is the interquartile range of the data, are there any outliers?
- Create a table in Microsoft Excel illustrating how one would find standard deviation in stepwise fashion. You will need to understand the formula to do this.
- Create a scatter plot between the profit variable and age variables. Is there a direct or indirect relationship between the two variables? What is the correlation coefficient?
- About 95% of the data fall between what two values for the quantitative variables? About 70% of the data fall between what two values for the quantitative variables? Explain which rule (Empirical or Chebychev) you used to calculate this outcome and why. What does this say about how the data varies about the mean?
- Create a frequency and relative frequency table for each qualitative variable. Be sure to create bar graph and pie chart for each variable. Which category has the largest frequency for each variable? Which category has the smallest frequency smallest frequency? Around which categories does the data tend to cluster? To answer these questions, use the exercises shown in the online lecture. Specifically, perform these calculations by writing formulas in excel.
- Based on the descriptive statistics, what useful advice can you give?
Step by Step Solution
There are 3 Steps involved in it
Step: 1

Get Instant Access to Expert-Tailored Solutions
See step-by-step solutions with expert insights and AI powered tools for academic success
Step: 2

Step: 3
Ace Your Homework with AI
Get the answers you need in no time with our AI-driven, step-by-step assistance
Get Started
Prealgebra
Authors: Elayn Martin Gay
7th edition
321955048, 978-0321955043