Answered step by step
Verified Expert Solution
Question
1 Approved Answer
Create a function called my_plot that takes the following inputs: A data matrix, where the first column is the x-values, and each additional column is
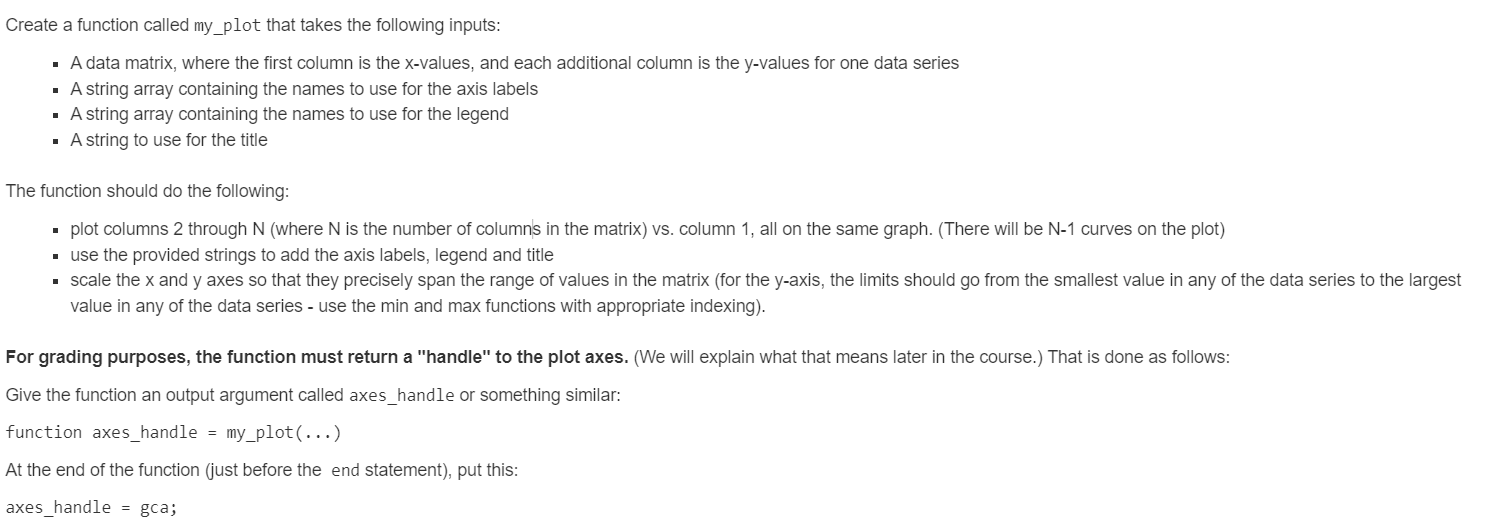
Create a function called my_plot that takes the following inputs: A data matrix, where the first column is the x-values, and each additional column is the y-values for one data series A string array containing the names to use for the axis labels A string array containing the names to use for the legend A string to use for the title 1 The function should do the following: plot columns 2 through N (where N is the number of columns in the matrix) vs. column 1, all on the same graph. (There will be N-1 curves on the plot) use the provided strings to add the axis labels, legend and title scale the x and y axes so that they precisely span the range of values in the matrix (for the y-axis, the limits should go from the smallest value in any of the data series to the largest value in any of the data series - use the min and max functions with appropriate indexing). For grading purposes, the function must return a "handle" to the plot axes. (We will explain what that means later in the course.) That is done as follows: Give the function an output argument called axes_handle or something similar: function axes_handle = my_plot(...) At the end of the function (just before the end statement), put this: axes_handle = gca
Step by Step Solution
There are 3 Steps involved in it
Step: 1
Get Instant Access to Expert-Tailored Solutions
See step-by-step solutions with expert insights and AI powered tools for academic success
Step: 2
Step: 3
Ace Your Homework with AI
Get the answers you need in no time with our AI-driven, step-by-step assistance
Get Started