Answered step by step
Verified Expert Solution
Link Copied!

Question

1 Approved Answer

Create a GUI using JavaFX. The program will read from a file, look at each character in the record and count the frequency for each
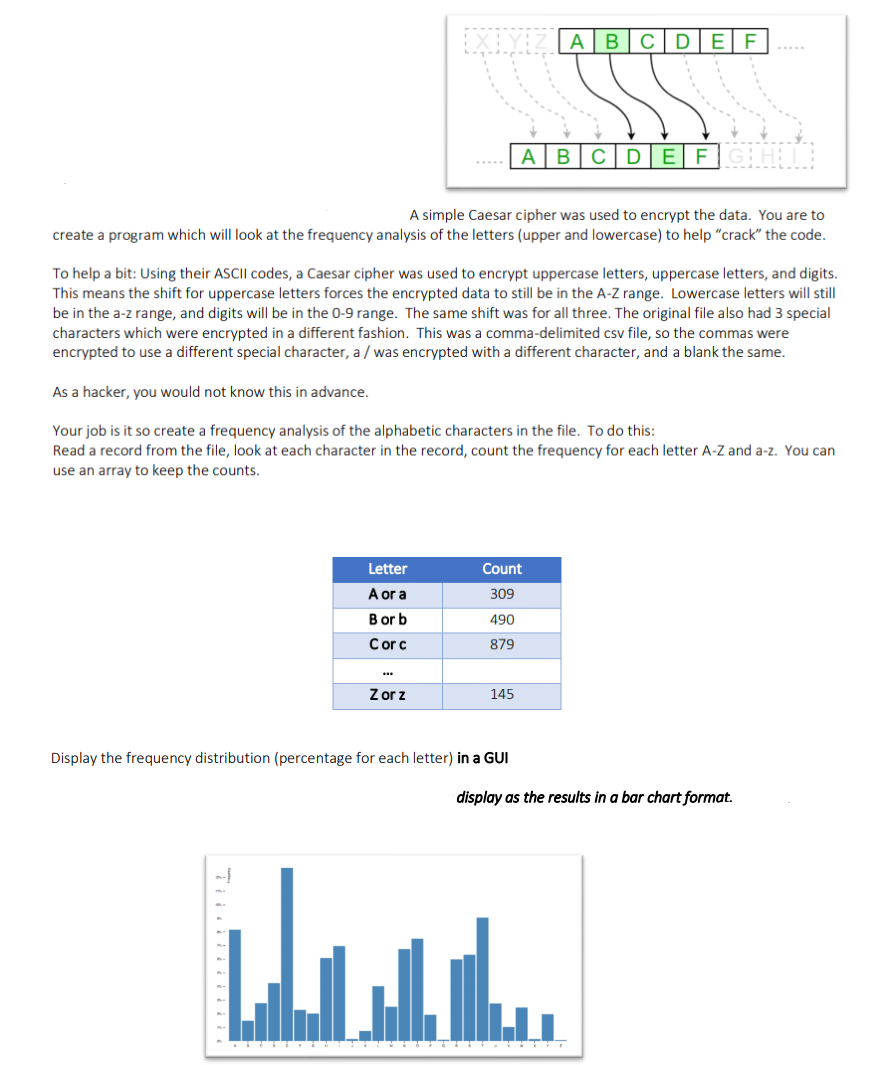
image text in transcribed

Create a GUI using JavaFX. The program will read from a file, look at each character in the record and count the frequency for each letter A-Z and a-z. Use an array to keep the counts. Some of the records in the file are below:

155031632{T{Lkdpu{L{Jhzapssv{846=Thwsl=Jvbya{Lknhy=Zwypunz{TV{32139{5}81}8616{TJ{2030217015616218{88}9788
946597569{M{Qluupmly{K{Dpsspht{8522=Nvskpl=Shul{Jpujpuuhap{VO{12970{87}91}8652{TJ{2253492215014906{89}9781
303784422{M{Spukh{I{Qlzzlu{9985=Dhyk=Yvhk{Ls=Whzv{AE{46673{3}9}8656{C{1209637842621877{3}9788
187266750{M{Svbpz{K{Zpttz{846=Dvvkypknl=Shul{Tltwopz{AU{05883{9}86}8654{TJ{2088891837810466{0}9789
994898936{T{Obtilyav{H{Yhtpylg{8096=Tlsvkf=Shul{Ypjotvuk{CH{90999{5}97}8603{TJ{2020608298908741{5}9781
ABCDEF ABCDEFIGHT A simple Caesar cipher was used to encrypt the data. You are to create a program which will look at the frequency analysis of the letters (upper and lowercase) to help "crack" the code. To help a bit: Using their ASCII codes, a Caesar cipher was used to encrypt uppercase letters, uppercase letters, and digits. This means the shift for uppercase letters forces the encrypted data to still be in the A-Z range. Lowercase letters will still be in the a-z range, and digits will be in the 0-9 range. The same shift was for all three. The original file also had 3 special characters which were encrypted in a different fashion. This was a comma-delimited csv file, so the commas were encrypted to use a different special character, a / was encrypted with a different character, and a blank the same. As a hacker, you would not know this in advance. Your job is it so create a frequency analysis of the alphabetic characters in the file. To do this: Read a record from the file, look at each character in the record, count the frequency for each letter A-Z and a-z. You can use an array to keep the counts. Letter Count 309 A or a Borb 490 Corc 879 Zor z 145 Display the frequency distribution (percentage for each letter) in a GUI display as the results in a bar chart format

Step by Step Solution

There are 3 Steps involved in it

Step: 1

blur-text-image

Get Instant Access to Expert-Tailored Solutions

See step-by-step solutions with expert insights and AI powered tools for academic success

Step: 2

blur-text-image

Step: 3

blur-text-image

Ace Your Homework with AI

Get the answers you need in no time with our AI-driven, step-by-step assistance

Get Started

Recommended Textbook for

Database Processing Fundamentals Design

Authors: Marion Donnie Dutton Don F. Seaman

14th Edition Globel Edition

1292107634, 978-1292107639

More Books

Students also viewed these Databases questions

Question

What is the environment we are trying to create?

Answered: 1 week ago

Question

How would we like to see ourselves?

Answered: 1 week ago